RevGrowth OS · Close the Revenue-to-Value Gap
Engineer revenue. Compound value.
Most mid-market companies chase revenue. The best ones grow revenue that compounds into enterprise value.
The gap between them is where the money is lost. And it's where the money is made. RevGrowth OS is the operating system that closes that gap.
200+
Companies benchmarked
25
Growth drivers measured
20-30
Average number of growth opportunities identified and quantified from benchmarking
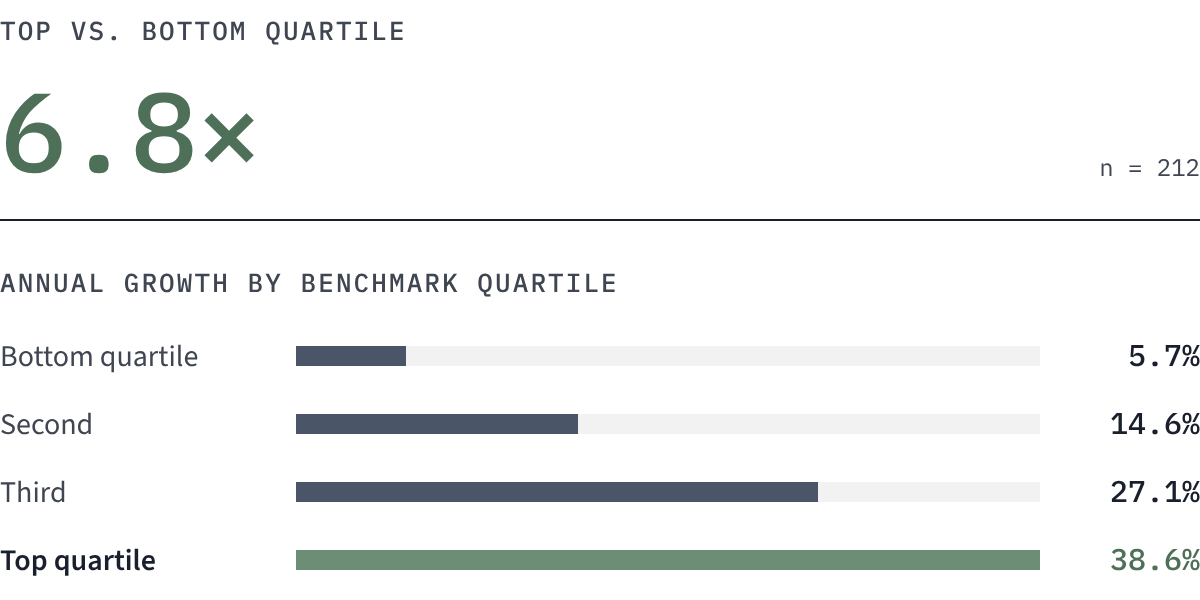
6.8x
Top-quartile companies outgrow the bottom quartile
The Revenue-to-Value Gap
Revenue is the number everyone watches. Enterprise value is the number that actually matters most.
A company can grow 15% a year and still be worth less than a competitor growing at 8%. The difference is not the top line. It's whether the growth is a system or a story.
That gap has a name. And it has a fix.
The Gap Opens When
a
Growth depends on people instead of a process.
b
Revenue rises but margin compresses.
c
The plan lives in a deck, not an operating cadence.
d
A buyer looks under the hood and finds heroics, not infrastructure.
The five leaks that kill enterprise value.
Many leadership teams can't see where the value is leaking, often seeing symptoms, not the system.
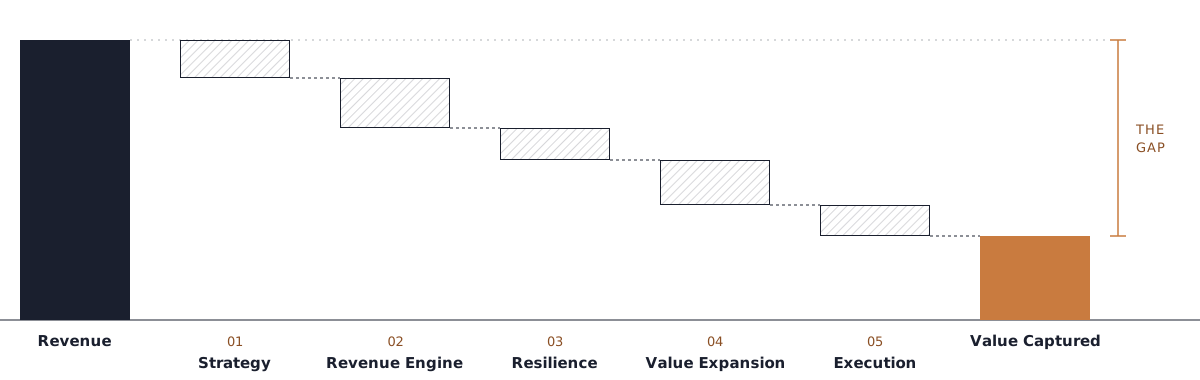
RevGrowth OS closes all five.
01
Strategy Leak
No clear and durable competitive advantage or compounding plan.
03
Resilience Leak
The business can't withstand shocks or adapt quickly enough.
05
Execution Leak
Good ideas die in PowerPoint. Priorities shift every quarter.
02
Revenue Leak
Customer acquisition, retention, and transaction mechanics are suboptimal.
04
Value Expansion Leak
The assets that drive your multiple are underinvested.
How RevGrowth OS works
Three layers. One loop.
Step 01: RevGrowth Architecture
Map it.
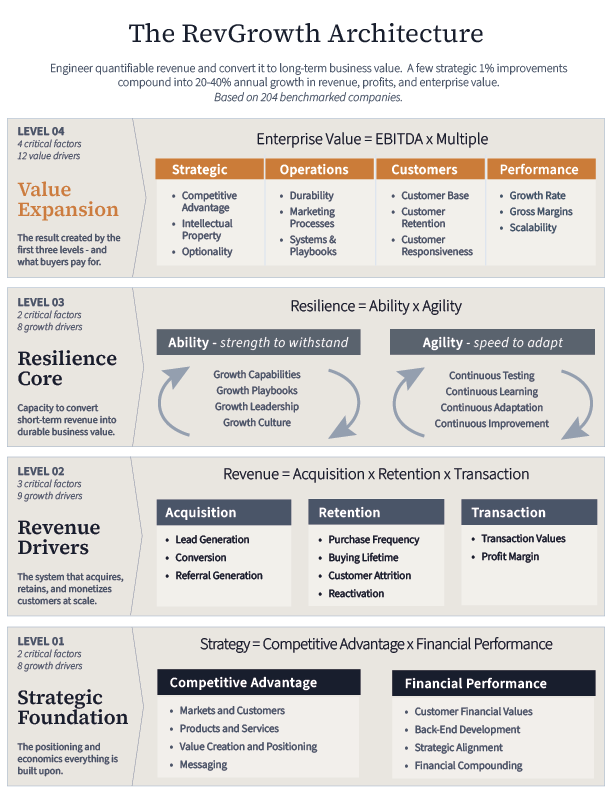
The RevGrowth Architecture gives sustainable growth a structure. Strategic Foundation, Revenue Drivers, Resilience Core, and Value Expansion. It defines what to measure and what to move.
Step 02: RevGrowth Benchmark
Measure it.
The RevGrowth Benchmark scores your company against 200+ benchmarked peers. By measuring your performance against the Architecture, it produces a diagnosis and identifies your growth gaps and opportunities.
Step 03: RevGrowth Engine
Move it.
The RevGrowth Engine turns those opportunities into a plan and cadence. The goal is roughly 1% improvement per driver per quarter. That compounds into 20-40% annual growth in revenue, profits, and enterprise value.
What you get
A growth system that is designed, measured, and run like every other function in the business.
01
A benchmarked view of where you stand.
02
A plan built on your numbers, not generic best practices.
03
A 90-day cadence that turns strategy into executed results.
04
A direct path from revenue growth to enterprise value.
Who it's for
CEOs
Mid-market CEOs who are tired of growth that resets every year.
Private Equity
Private equity sponsors and operating partners who need growth diligence and value creation that survives the hold period.
CFOs & CROs
CFOs and CROs who want a common language for revenue, risk, and value.
Three easy ways to see if you're a good fit.
Quick Read: 3 minutes
The Ceiling Scan
Seven questions. Three minutes. One ceiling named.
Your Position: 10 minutes
The RevGrowth Score
Ten minutes. Get your position, not a grade.
Your Numbers: 60 minutes
The RevGrowth Simulation
One hour. Your numbers with the RevGrowth Benchmark. No cost. No pitch.
The proof
The RevGrowth Architecture is built on 200-plus benchmarked companies. Top quartile companies average 38.6% annual revenue growth. Bottom quartile companies average5.7%. Same 25 drivers, scored the same way, often in the same markets.
Modeled potential
20-40%
Annual growth potential in revenue, profit, and enterprise value, identified by our compounding model from a few strategic 1% improvements across nine revenue drivers.
The next step to close the Revenue-to-Value Gap.
See what engineered growth looks like with your numbers.
In one hour, we run your company through the RevGrowth Architecture and Benchmark. You leave with a clear diagnosis of where value is leaking and a concrete picture of what 20-40% annual growth in revenue, profit, and enterprise value looks like for your business.
No cost. No pitch. Just your numbers and a conversation.