
Who We Work With
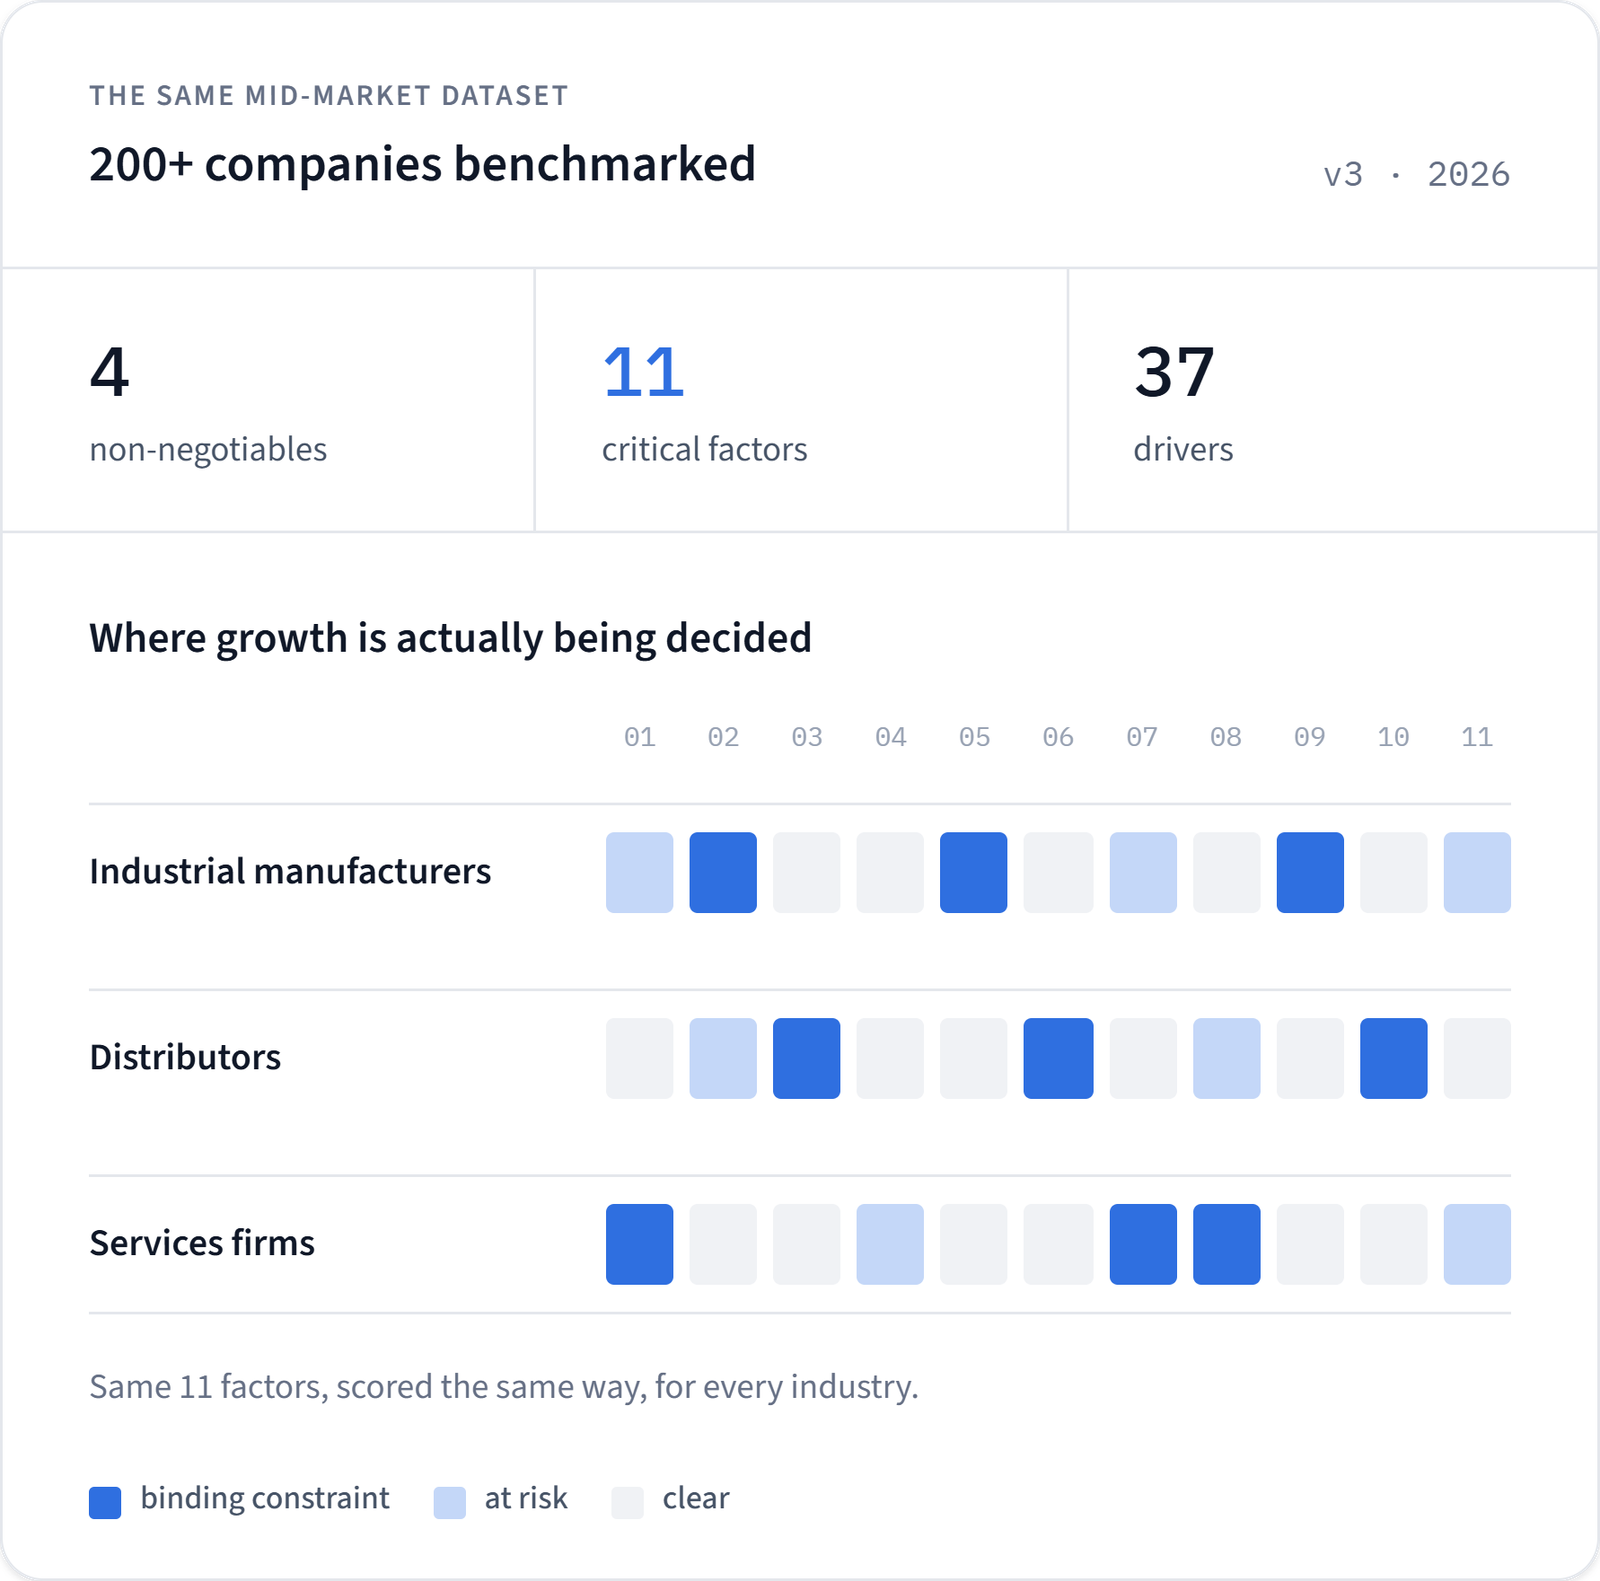
Different industries. The same 11 factors decide who grows.
Your products, cycle times, and channels are nothing alike. The mechanics of sustained growth are. Across 200+ mid-market companies, the same 4 non-negotiables, 11 critical factors, and 37 drivers separate the companies that compound from the ones that grow in bursts. Industry changes which drivers you're weak on. It does not change the list.
One hour. Your data. Zero cost.
Manufacturers
You instrument the floor. We instrument the growth.
You know your OEE, your scrap rate, your on-time delivery to two decimal places. Ask what your quoting-to-close conversion says about pricing power and the numbers get softer.
The RevGrowth Benchmark scores the growth engine the way you already score production: against a standard, driver by driver. You leave knowing which of the 37 drivers are holding revenue below what the plant could support.
Proof:


Distributors
Volume moves. Position compounds.
Distribution growth usually arrives as accumulation: another line, another branch, another rep's book of business. It works until the margin math stops working.
Benchmarking separates the two. It shows which drivers are producing volume you have to keep buying, and which are producing position that keeps paying, so the next dollar of growth costs less than the last one.
Proof:
Industrial Services
When growth runs through three people, it isn't a system yet.
Professional and technical services firms grow on reputation, relationships, and a small number of people who can close. That's a real asset. It's also the constraint on the next $20M.
The RevGrowth Architecture converts what your best people do intuitively into how the firm operates. Same judgment, more of it, less dependent on who's in the room.
Proof:

Yes, we work with private equity firms.
Diligence tells you what you bought. Benchmarking tells you what it can become.
Financial and commercial diligence establish the position. Neither scores the growth engine against peers, and neither tells the operating partner which levers move first in the first 100 days.
The RevGrowth Benchmark gives you a scored, comparable read across the portfolio: where each company sits on 37 drivers, which gaps are closable this year, and where the value creation plan is resting on assumptions rather than position.
Visit our Private Equity page to learn more.
Position, Not Opinion
Frameworks give you opinions. Benchmarks give you position.
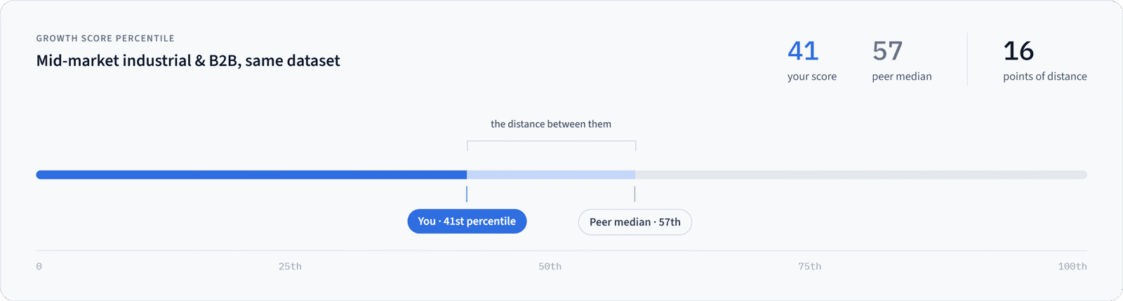
Every score comes from the same dataset of mid-market industrial and B2B companies, scored across 4 non-negotiables, 11 critical factors, and 37 drivers of sustained growth. You see your number, the peer median, and the distance between them.
Fit
Where the RevGrowth Benchmark works, and where it doesn't.
It works when you sell to businesses, do $10M to $500M in revenue, own a sales function, and have growth that arrives in bursts rather than on a curve.
It doesn't work yet if you're pre-revenue, primarily consumer, or below $10M. There isn't enough operating history to benchmark against, and you'd be paying for precision you can't use.
Not sure if you're a fit? Take the Growth Predictability Score. Ten minutes, online, free.
The RevGrowth Simulation
Run your own numbers first.
Bring your data to a one-hour working session. We run it through the RevGrowth Benchmark and show you where your growth is being decided.
No deck. No discovery call before the discovery call. You leave with your position against 200+ peers and the drivers most likely to move next, whether or not you ever work with us.
60 minutes - built on your data - CEO level - no obligation