
Insights
Don't just read about the system. Operate it.
RevGrowth OS is built on 200+ benchmarked mid-market companies scored across 4 non-negotiables, 11 critical factors, and 37 drivers of sustained growth. This is where you take it apart.
4
Non-Negotiables
11
Critical Factors
37
Drivers of Sustained Growth
From the Blog
Findings, written up.
Each of these started as a pattern in the benchmark data - something that appeared across enough companies to stop being a coincidence. Filed under the RevGrowth Architecture level it speaks to.
Growth Infrastructure: The Manifesto
Growth is the one system nobody ever instrumented.
200+ companies benchmarked. One straight line. The difference between good and great was never a secret - it was just unmeasured.
RevGrowth Benchmark
Frameworks give you opinions. Benchmarks give you positions.
A framework can't tell you whether 10% growth is good, but a benchmark can.
RevGrowth Architecture
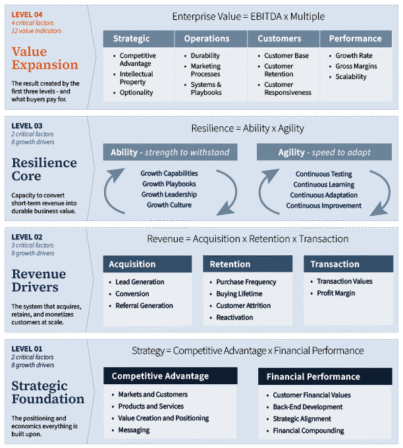
The 4-7-25 structure, explained.
The cascade structure behind the RevGrowth Architecture, connecting 4 non-negotiables to 7 critical factors to 25 measurable.
RevGrowth Benchmark
What 200+ mid-market companies reveal about growth.
Across 200+ companies in the RevGrowth Benchmark, the top quartile grows seven times faster than the bottom. And the gap isn't talent, luck, or market, it's measurement.
Revenue Benchmark
Why the bottom quartile has the highest upside potential.
Bottom quartile sounds like a verdict on your team, but it's actually the biggest opportunity on the board, because the gap isn't effort, it's an unmeasured system.
Revenue Engine
What "20-40% growth" actually means, and what it doesn't.
The improvements revealed through benchmarking and action planning, not an observed spread of participant growth rates.
Visit the Growth Benchmark Blog
Get Your RevGrowth Score
Ten minutes to find out where you actually sit.
The findings tell you what the data says. They don't tell you where you are in it. The RevGrowth Score scores your company against some of the same non-negotiables and critical factors we score every benchmarked company on. Ten minutes, online, no call required.
You get a position, not a grade.
Ten minutes. Online. No call required.
6.1%
Bottom quartile
15.7%
Second quartile
28.0%
First quartile
39.8%
Top quartile
Median annual growth by benchmark quartile across 200+ mid-market companies. First quartile is the lowest-scoring group.
Our IP
The RevGrowth Operating System
RevGrowth OS didn't start as a product. It started as a pattern that kept surfacing across three decades of growth work, and eventually across 204 benchmarked companies. What follows is the whole thing: three pillars, working as a flywheel — and the four levels inside the blueprint that ties them together. Nothing held back for the sales call.
01
RevGrowth Architecture
Map it. What closes the gap.
The blueprint. A four-level framework that defines what has to be true for growth to compound instead of reset — the standard everything else in the system measures against.
02
RevGrowth Benchmark
Measure it. Where you sit against 200+ benchmarked companies.
The instrumentation. Every Driver scored 0–100 against the dataset — the diagnostic engine that replaces opinion with position.
03
RevGrowth Engine
Move It. What keeps it moving and compounding.
The instrumentation. Every Driver scored 0–100 against the dataset — the diagnostic engine that replaces opinion with position.
Additional components of the RevGrowth Operating Syystem
04
The ART of Revenue Growth
Drive double-digit growth through retention.
The mechanics of keeping and expanding revenue you've already earned - and why retention shows up in the benchmark as a growth driver rather than a defensive metric.
04
The Retention Loop
Drive double-digit growth through retention.
The mechanics of keeping and expanding revenue you've already earned - and why retention shows up in the benchmark as a growth driver rather than a defensive metric.
05
The Resilience Core
Create growth that holds up under pressure.
What separates companies that keep compounding through a downturn from those that give the gains back. Built from what the benchmark shows about durability.
06
Equity Evolution
What the business is worth when growth is predictable.
The line from operating improvement to enterprise value. Built for owners and sponsors who want the multiple and the revenue line.
Explainer Videos
Explainers
What each part of the engagement is, what it produces, and what it costs you in time.
RevGrowth Simulation
One hour, your data, and a benchmark position at the end of it. What happens in the session and what you walk out with.
RevGrowth Catalyst
The two-day intensive. How a benchmarked position becomes a quantified plan, and what a room looks like on day two.
RevGrowth Assurance
What governance looks like after the plan exists - and why the gap between the good plan and a compounding one is almost always cadence.
About RevGrowth OS
Where the benchmark and architecture came from, how 200+ companies got scored, and why the method starts with position rather than strategy.
You've seen the system. Now run your numbers through it.
The RevGrowth Simulation is a working session, not a sales call. You bring your numbers. We run them against the Benchmark. You leave with a position.
One hour. Your data. Zero cost.
Not ready for the full hour? Take the RevGrowth Score assessment first (10 minutes)