
The Growth Benchmark Blog
What "20-40% Annual Growth" Actually Means, and What It Doesn't
by Russ Holder
Founder & CEO
RevGrowth OS, LLC
You should question a number like this before accepting it. "20–40% annual growth" appears often in RevGrowth OS material for a reason. It is the growth range the RevGrowth Benchmark identifies when a
company measures its position, closes the ranked gaps, and re-measures on a set cadence. Here is what that number is built from, and just as important, what it does not claim.
Where the Number Comes From
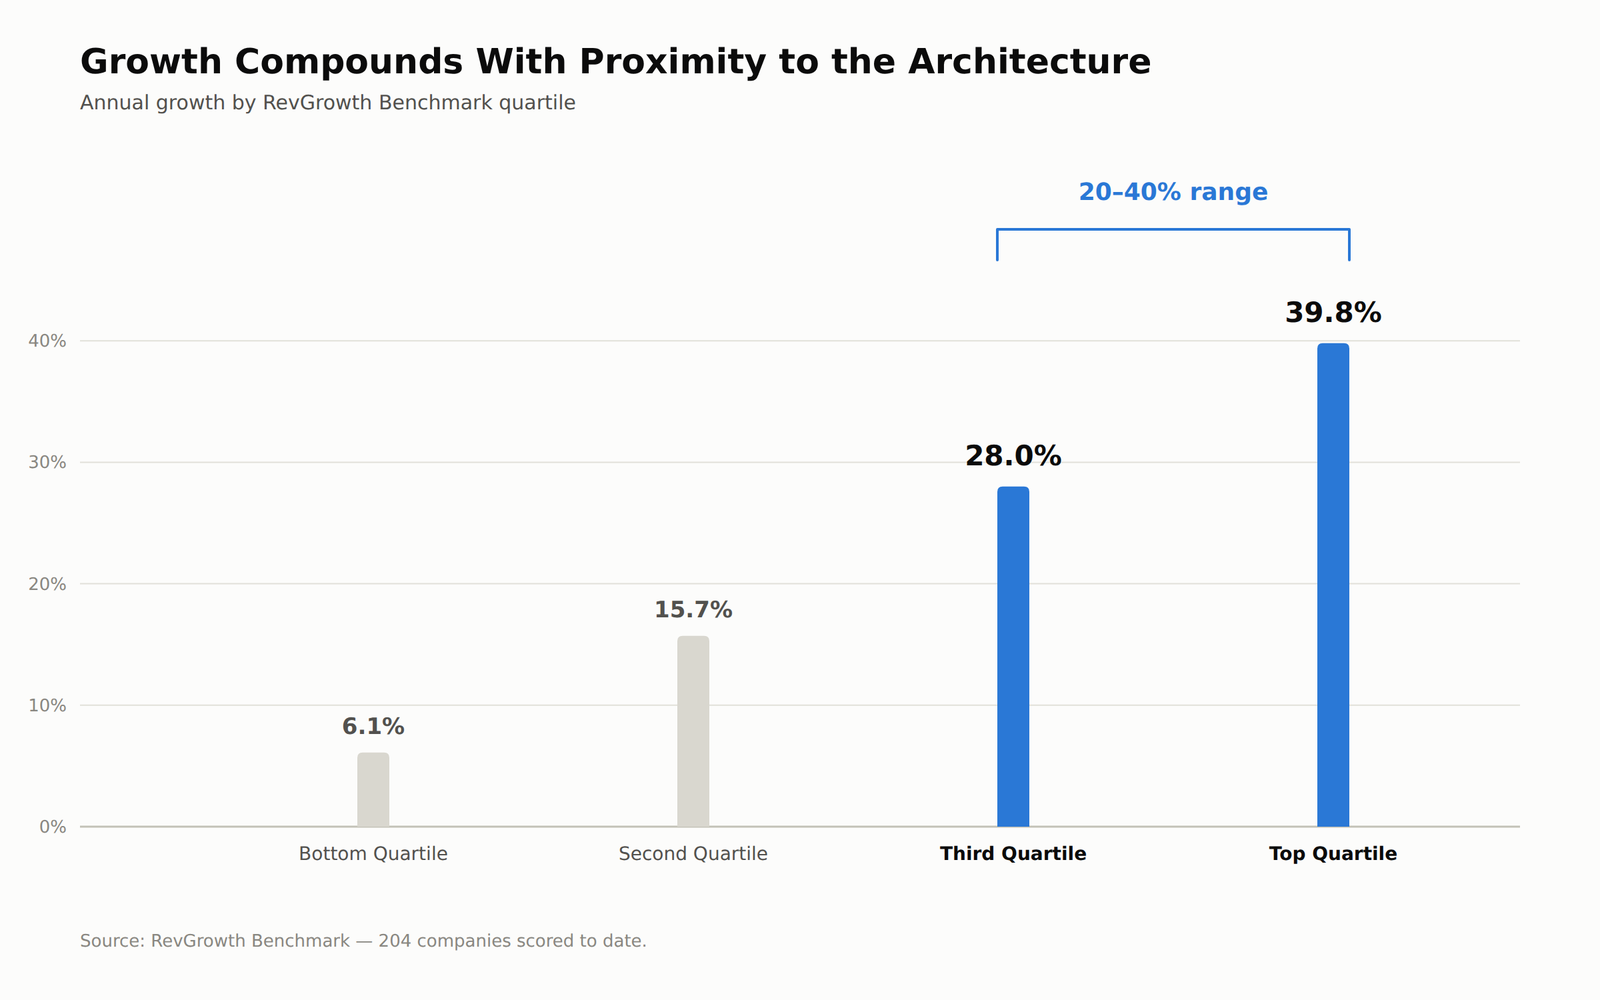
This figure is not a promise. It describes what the RevGrowth Benchmark has found across 204 companies that closed the specific gaps identified for them. Growth compounds in a straight line with proximity to the RevGrowth Architecture: bottom quartile at 6.1% a year, second at 15.7%, third at 28.0%, top quartile at 39.8%. The 20–40% range sits in the top half of that spread. It is the outcome for companies that used their Benchmark results to find and stack deliberate 1% improvements, cycle after cycle, instead of chasing a single big bet.
This is the mechanism behind the number. It is not a single lever or a forecast made in advance. The RevGrowth Benchmark identifies this pattern after the fact, in companies that run the loop it prescribes: measure, find the gap, fix it, re-measure. Repeat this process on a set cadence, and small gains compound. The result looks dramatic from the outside and incremental from the inside.
What It Doesn't Mean
It does not mean every company that runs the RevGrowth Benchmark will grow 20–40% next year. The number describes what the Benchmark has found in companies that closed their gaps and kept closing them.
It does not mean one initiative gets you there. The RevGrowth Benchmark has not found a single fix that produces this kind of compounding result. It is the accumulation of 20 to 30 identified opportunities, sequenced and executed on a fixed rhythm. That is the RevGrowth Engine's job, not a one-time project.
It also does not mean this happens through execution alone, without measurement. Companies producing this range are not working harder than those at 6.1%. They are working against a scored, comparative view from the RevGrowth Benchmark. They know exactly where the highest-leverage gaps are, instead of guessing and hoping.
What It Actually Predicts
The claim is simple. A company that runs the RevGrowth Benchmark, closes its highest-leverage gaps in sequence, and re-measures on a set cadence tends to converge on the top half of the quartile spread over time. That is where the 20–40% figure comes from. This pattern appeared across 204 companies, all measured the same way. It doesn't guarantee results for any one company. No single number can account for a company's starting position, market, or execution.
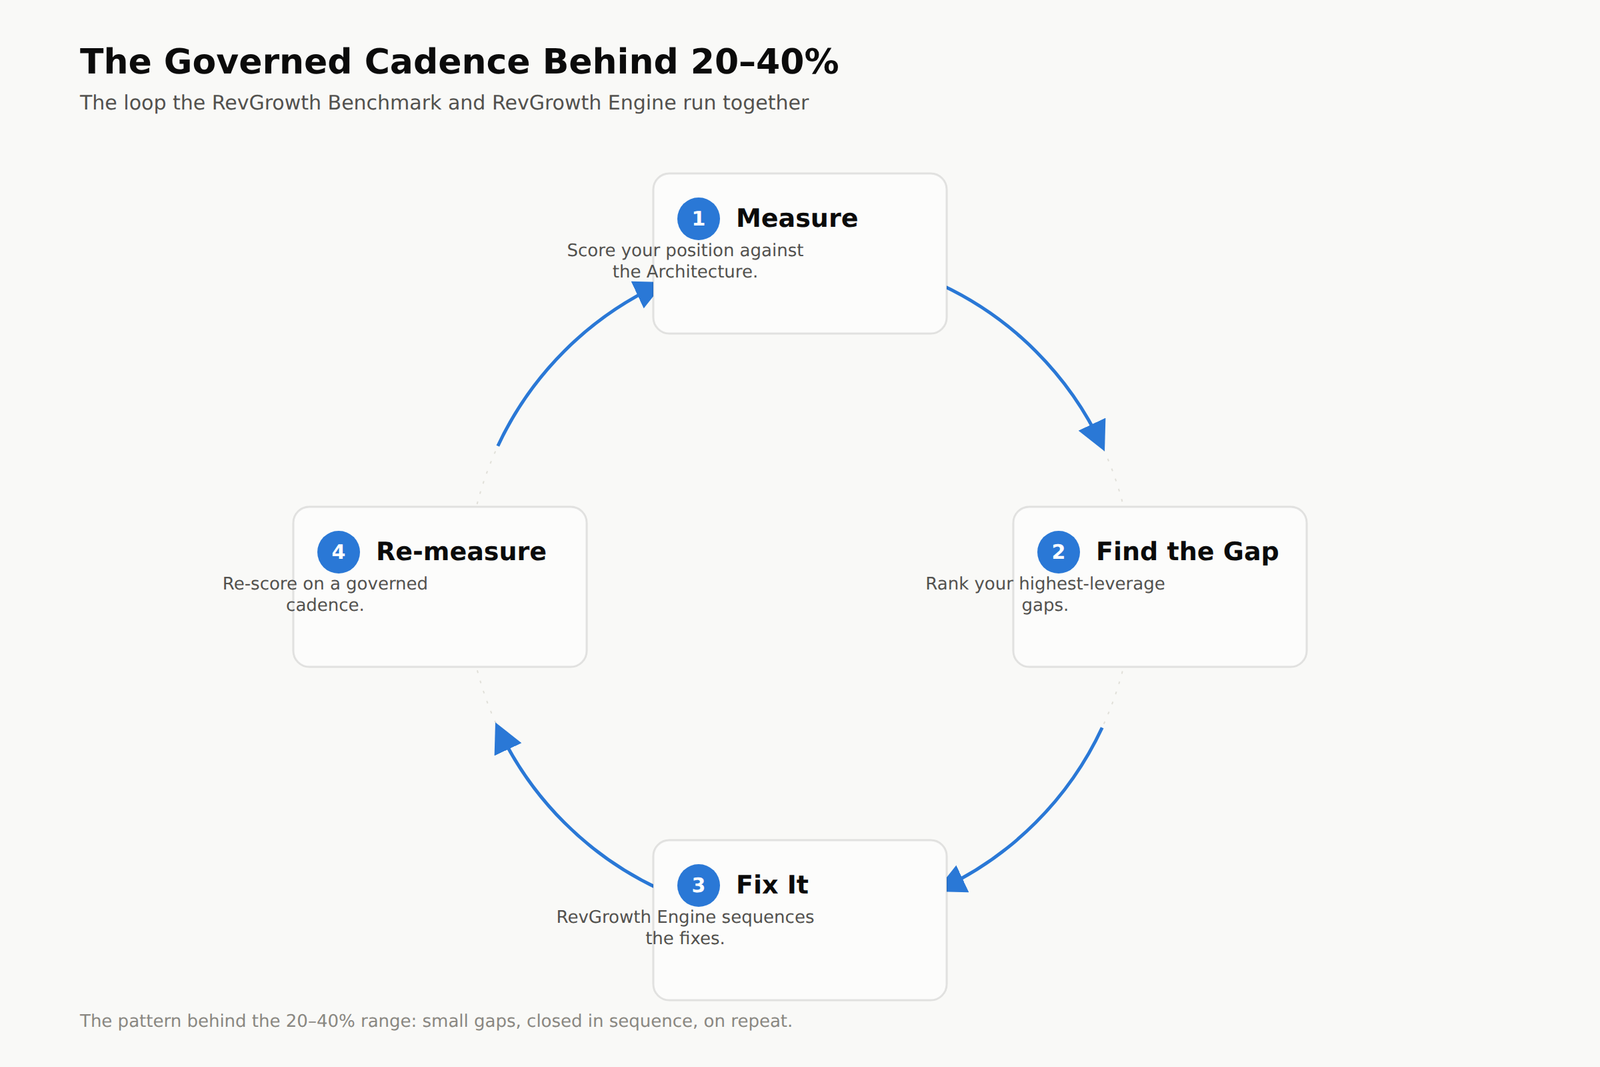
This distinction matters. It is the difference between a credible claim and a marketing number. A marketing number says you will get this. A pattern the Benchmark identifies says this is what happened to companies that did the specific, repeatable things. Here is exactly what those things were, so you can check whether you are doing them too.
How to Use the Number Honestly
Treat 20–40% as a description of the destination the RevGrowth Benchmark has identified, not a delivery date. The useful question is not whether you will hit that number. It is where the Benchmark says you sit right now, and what the specific, ranked gaps are between your position and the companies already growing at that rate. That is a question a benchmark can answer. A growth rate promised in advance, without first measuring where a company stands, is the kind of claim this category exists to replace.
Frameworks give you opinions. The RevGrowth Benchmark gives you position. And a position is the only honest starting point for a number this size.
One hour. Your data. Zero cost. Run the RevGrowth Simulation and find out which quartile your own numbers put you in.
Benchmark your strategy. Engineer your growth.
When you’re ready to see where you actually stand, the RevGrowth Simulation is where this starts. One hour, your own numbers, no cost, and no proposal at the end of it.

The RevGrowth Score
Ten minutes to find out where you actually sit.
The findings tell you what the data says. They don't tell you where you are in it. The RevGrowth Score scores your company against some of the same non-negotiables and critical factors we score every benchmarked company on. Ten minutes, online, no call required.
You get a position, not a grade.
Ten minutes. Online. No call required.
The RevGrowth Simulation
Find out which one you are.
The RevGrowth Simulation is a one-hour working session using your own numbers. You'll see where your growth system sits against 200+ mid-market companies, and what the gap is worth.
60 minutes - built on your data - CEO level - no obligation