The RevGrowth Installation · Two-Day Intensive
Two months of analysis, compressed into two days.
Day one is the full RevGrowth Benchmark. Day two turns the scores into the RevGrowth Engine: sequenced actions, an owner and a date for each, and an operating cadence.
4
Phases
9
Components
10x
Minimum ROI identified
The RevGrowth Simulation sizes the return for your company first.
How the two days are built. Nothing is improvised.
Phase 01: Pre-Workshop
Data collection.
We gather your growth data in advance. Financials, pipeline, retention, pricing, market position.
Phase 02: Day One
RevGrowth Benchmark
We score your growth infrastructure across four non-negotiables, seven critical factors, and 25 drivers, then compare each result to the 200-plus company dataset.
Phase 03: Day Two
Action planning.
We map the gaps to the RevGrowth Architecture, quantify their financial value, then convert them into the RevGrowth Engine: sequenced actions, an owner and a date for each, and an operating cadence.
Phase 04: After
Debrief
We walk your leadership team through findings, priorities, and the first 90 days.
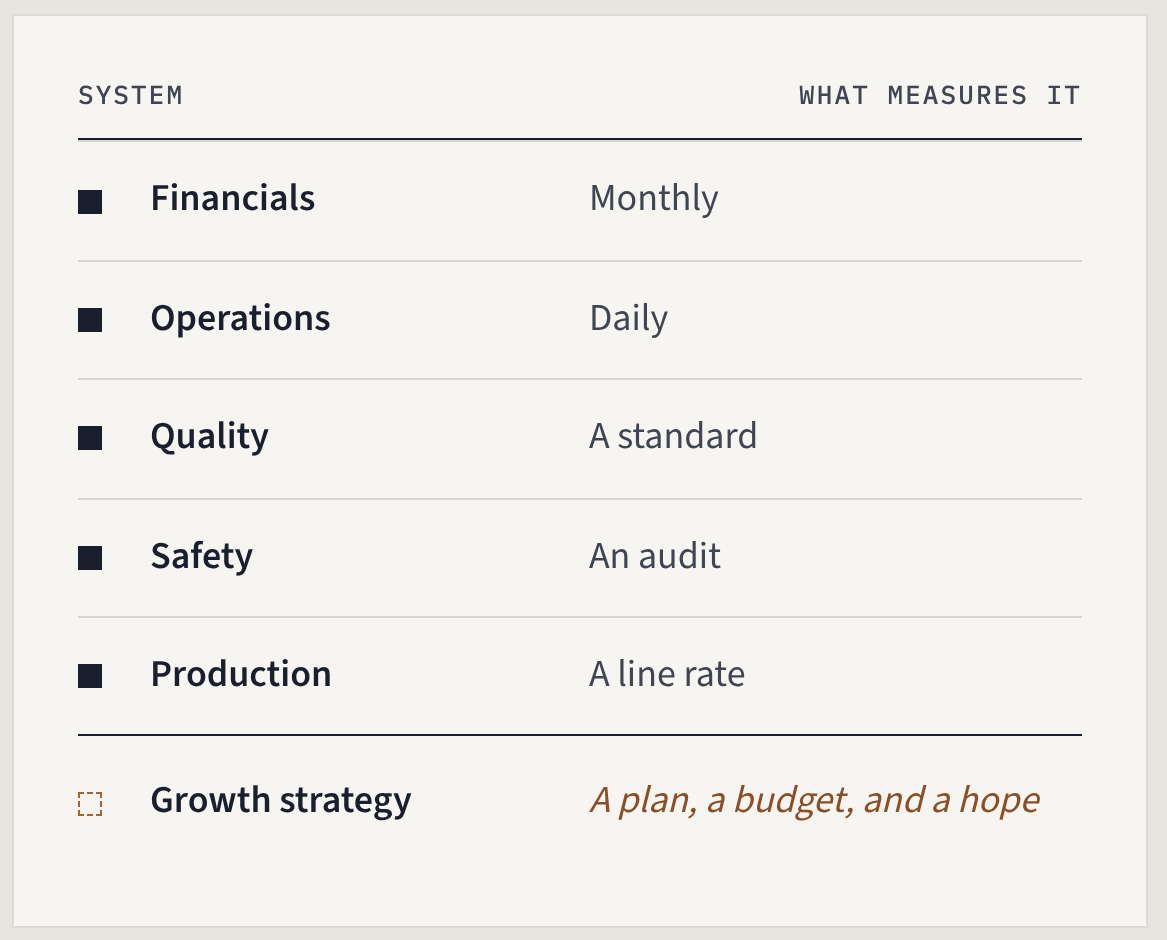
Growth is the one system nobody ever instrumented.
You run financials monthly. You track operations daily. Quality has a standard, safety has an audit, production has a line rate.
Growth strategy gets a plan, a budget, and a hope. When results come in short, the debate is about people and market conditions, because there is no measurement to point at.
Signs the RevGrowth Installation is a good fit.
Tick the ones that sound familiar.
You leave with an action plan, not a summary.
01
Benchmark Scorecard and Gap Analysis
Your benchmark scores across the four non-negotiables and seven critical factors that determine growth.
02
Growth Gap Analysis
Where revenue is leaking and why.
03
RevGrowth Resilience Index
How well your organization converts short-term revenue into durable business value.
04
Growth Driver Impact Analysis
Which drivers move the needle, and by how much.
05
Opportunity Analysis
Between 20 and 30 specific growth opportunities, each ranked by quantified impact, degree of certainty, and cost to execute.
06
ROI Report
The minimum 10× return identified by the action plan.
07
RevGrowth Engine
An action plan and operating cadence that puts the prioritized actions on a calendar with names attached.
Before you commit two days
See the RevGrowth Benchmark run on your numbers, in one free hour.
The work doesn't get harder. The arguments get shorter.
Before
After
Diagnosis
Results vary and the cause is contested.
Every element of the growth engine has a score and a peer comparison.
Planning
Next year's growth ideas come from whoever argues best.
Opportunities are ranked by quantified impact, certainty, and cost to execute.
Execution
The plan lives in a deck and gets revisited quarterly - or less often.
The plan lives in an operating cadence with owners and a review rhythm.
Planning
Change and disruption require a new strategy.
You re-score, see what moved, and adjust the existing one.
Built for companies already running a plan, not looking for one.
Episodic growth, sales performance that varies by person, marketing activity nobody can tie to revenue, deals lost that product quality does not explain, priorities that live in a deck instead of a cadence. If two or more sound familiar, the gap is worth measuring.
Poor Fit
It is a poor fit if you want strategy delivered to you. The RevGrowth Installation is a working session. Your team does the deciding.
See the RevGrowth Benchmark in action before you spend a dollar.
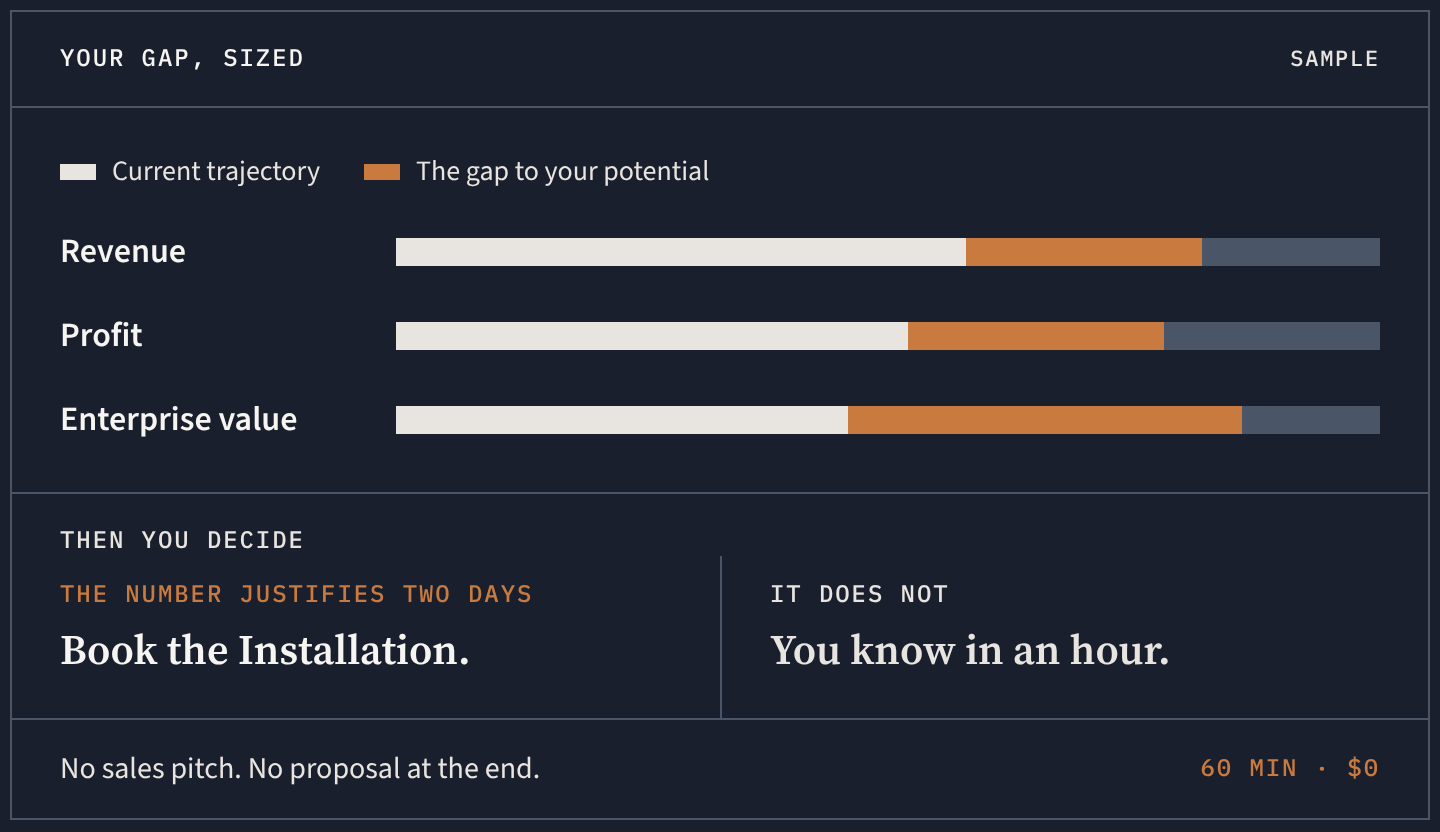
In one hour we run your data through the RevGrowth Benchmark and show you what closing the gap would be worth to your company.
No sales pitch. No proposal at the end. You leave with a sized view of the gap between your current trajectory and your potential, in revenue, profit, and enterprise value.
If the number does not justify two days, you will know that in an hour.
One hour · Your data · Zero cost