
RevGrowth OS · Close the Revenue-to-Value Gap
Engineer revenue. See the gap. In one hour.
Most CEOs know they could grow faster. What they don't know is where the highest-leverage improvements are hiding, or what closing the gap is worth.
The RevGrowth Simulation runs your own numbers through the RevGrowth Benchmark and scores your growth infrastructure against over 200 mid-market companies B2B companies.
Benchmark your strategy. Engineer your growth.
The RevGrowth Benchmark reveals the causes of growth stalls and plateaus before they can damage your growth trajectory.
200+
Mid-market companies in the benchmark set
0.74 R2
Between benchmark score and annual growth
6.8x
Top-quartile growth vs. bottom quartile
$0
A working session with your data. Not a sales pitch.
It's a working session, not a sales pitch.
Most first meetings are a company describing itself to you. This one runs the other direction.
Most First Meetings
The RevGrowth Simulation
What Happens
A company describes itself to you.
We run the RevGrowth Simulation on your business, live, in compressed form.
What You See
A deck.
The gap, sized in terms your board already uses.
How It Ends
A proposal.
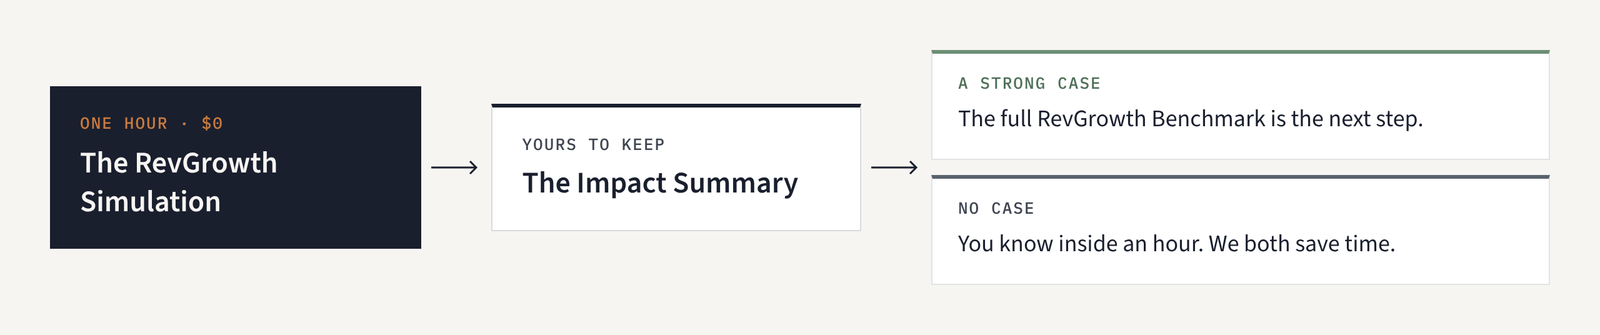
No invoice. No proposal. An Impact Summary that is yours to keep.
The difference is scope, not rigor. One hour instead of a full day.
We will not diagnose your business in an hour. Nobody can. What we will do is size the gap, in the terms your board already uses.
You get to see what growth looks like when it is actually engineered.
Sixty minutes. Three parts. One deliverable.
60 min
First 15 Minutes
Your data.
We review your numbers and your RevGrowth Score results.
Second 15 Minutes
RevGrowth Architecture.
We show you what growth engineering actually looks like.
Final 30 Minutes
Your potential.
We run the simulation and size the gaps. What your numbers look like if you move your RevGrowth Benchmark score to top-quartile performance, and what that compounds to over three years.
The RevGrowth Impact Summary
A three-column view of your business: current state besides the state your own data says is available to you.
01
Current CAGR besides available CAGR.
02
Current revenue besides projected revenue.
03
The same for profit and enterprise value, with a three-year return on the work required to close the distance.
It is built to be forwarded, and it is yours whether or not we ever work together.
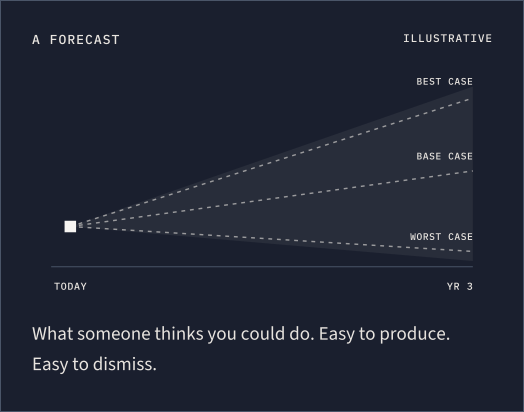
The right-hand column is not a forecast.
Projections are easy to produce and easy to dismiss. Your CFO has seen a hundred of them.
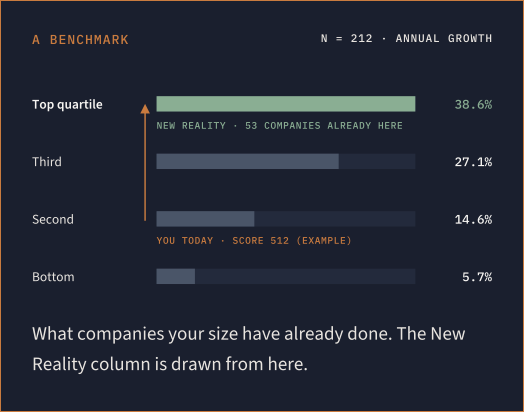
The New Reality column is what companies in the top quartile of the RevGrowth Benchmark actually achieve. 200+ mid-market industrial and B2B companies, measured across the same 25 drivers
We are not showing you what we think you can do. We are showing you what your numbers look like at the performance level companies your size have already reached.
The difference between a forecast and a benchmark is that others have already done it.
Your numbers and an honest hour.
First · Your Numbers
Nothing gets audited. If your numbers are directionally right, so is your benchmark. And the sharper your inputs, the sharper the result.
Second · Your RevGrowth Score
Your RevGrowth Score
Complete the free assessment on our site. It takes about ten minutes, and it gives you a good idea of what we do and how we work. Bring it to the Simulation and we start further down the field.
Why does it cost nothing? Because it's difficult to explain, but simple to demonstrate.
Diagnosing growth infrastructure is difficult to explain and simple to demonstrate. It is also the fastest qualification tool we have. In an hour, we both find out whether the potential is great enough to be worth anyone's time.
The RevGrowth Simulation sizes the gap. It does not explain it. Explaining it takes the full RevGrowth Benchmark. If the Impact Summary makes a strong case, that is the next step. If it does not, you will know inside an hour and we will both save time.
One Thing to Expect
Calculating return requires knowing what the work costs, so you will see engagement economics during the hour. There is still no deck and no proposal. That is arithmetic, not a pitch.
Build for one kind of company.
A Fit
Mid-market industrial and B2B.
Manufacturers, distributors, and services firms between $10M and $500M in revenue. Companies with a real business, a real ambition, and a gap between the two.
Not A Fit
Pre-revenue startups.
Companies looking for a quick fix without changing how they operate. Teams that do not want to see their own numbers.
Questions CEOs ask first.
Is this a sales pitch in disguise?
No. It's an opportunity for you to sample the RevGrowth Operating System and see it in action. This is the best way to see for yourself if it's relevant to your business and goals. There's no deck and no proposal. If we think there's a fit, we'll ask for a second conversation at the end. You can say no and keep the Impact Summary.
Do I have to take the assessment first?
No. It sharpens the result, but it isn't required. Show up with your numbers and we'll run the session either way. Companies who complete it first usually get more out of the hour, because we start further down the field instead of covering ground the assessment would have already covered.
Our data is messy.
So is almost everyone's, the first time they look at it this way. The Simulation isn't an audit - directionally right numbers produce a directionally right benchmark. Precision matters more once there's a reason to invest in it.
We're already growing.
Good. This isn't a rescue session. It's for companies that are already winning and want to know if they're leaving growth on the table. Across the RevGrowth Benchmark's 204 companies, top-quartile scores average 7X the growth of low scorers - and most companies have no way to know which quartile they're actually in until they measure it.
How is this different from the RevGrowth Benchmark?
Scope, not rigor. The Simulation runs the same framework in compressed form - one hour instead of a full day - using the numbers you bring rather than a full data pull. It sizes the gap. The full RevGrowth Benchmark explains it: driver-by-driver scores, a 90-day action plan, and the evidence behind the number the Simulation shows you.
Who should be in the room?
CEO, required. CFO, requested - the New Reality column is written in their language. One more seat is fine: a CRO, a board member, a large stakeholder. Past three, it turns into a presentation, and presentations don't decide anything.
One hour. Your data. Zero cost.
Schedule your RevGrowth Simulation
Tell us where to reach you and roughly what size the business is. We confirm a time within one business day and send a short list of the numbers to have on hand.
What Happens Next
01
We confirm fit over email.
02
You pick a time and send whatever figures you have.
03
One hour together, and the RevGrowth OS Impact Summary is yours to keep.