The RevGrowth Engine · Move It
Where growth becomes a daily discipline, not an annual event.
Every cycle improves two things, not one.
The Result
Annual growth rate
The System
Growth reliability
One Hour · Your Data · Zero Cost
A plan you revisit once a year moves you once a year.
Most growth plans do not fail in the room where they are built. They fail in the eleven months after, when the deck gets filed, the initiatives lose their owners, and the numbers get reviewed against nothing in particular.
Nothing was decided badly. The plan simply stopped being the thing anyone measured against.
That is not an execution problem you fix with more effort. It is a cadence problem. The absence of a governed rhythm that keeps the plan in front of the people accountable for it, on a schedule, against a fixed benchmark instead of a fading memory of last quarter.
The RevGrowth Engine is that rhythm. It is the third instrument on the panel, after the Architecture and the Benchmark, and it is the one that turns a diagnosis into a habit.
Three components, working in sequence.
Component 01
Action Planning
Translate benchmark gaps into a quantified plan and sequenced roadmap.
Component 02
Execution and Operating Rhythm
Run the roadmap on a fixed cadence.
Operating rhythms tend to fade once they have nothing to measure against, sliding back into status reporting. The Engine fixes that by tying every rhythm back to the Benchmark.
Component 03
Governance
Review results against the benchmark, not against last quarter.
One loop, run every cycle.
Every cycle either confirms the system is working or shows you exactly what to adjust. Nothing drifts, because nothing waits to be noticed.
Step 01:
Measure
Against the benchmark.
Step 02:
Quantify
Find the gap and put a dollar figure on what it costs you.
Step 03:
Decide
A governed decision with an owner and a date.
Step 04:
Execute
Over one cycle. Then the cycle repeats.

What works becomes a playbook. That is the part most transformation efforts skip. They produce a result and no reusable method, so the next team relearns it from scratch.
Output · The Playbook
A change that works once is luck. A change that works in a playbook is capability.
Built from 200-plus companies, not opinions.
Across the RevGrowth Benchmark dataset of over 200 mid-market industrial companies, the growth rate compounds with the quartile.
That spread is not talent or luck. It is cadence.
The companies at the top are not finding bigger opportunities than everyone else. They are running the same loop more often and letting fewer cycles pass without a governed decision.
Strategic 1% improvements, sequenced and executed on a fixed rhythm, compound into 20 to 40% annual growth in revenue, profit, and enterprise value.
Every cycle improves two things, not one.
The Engine does not just produce a result. It gets better at producing the next one.
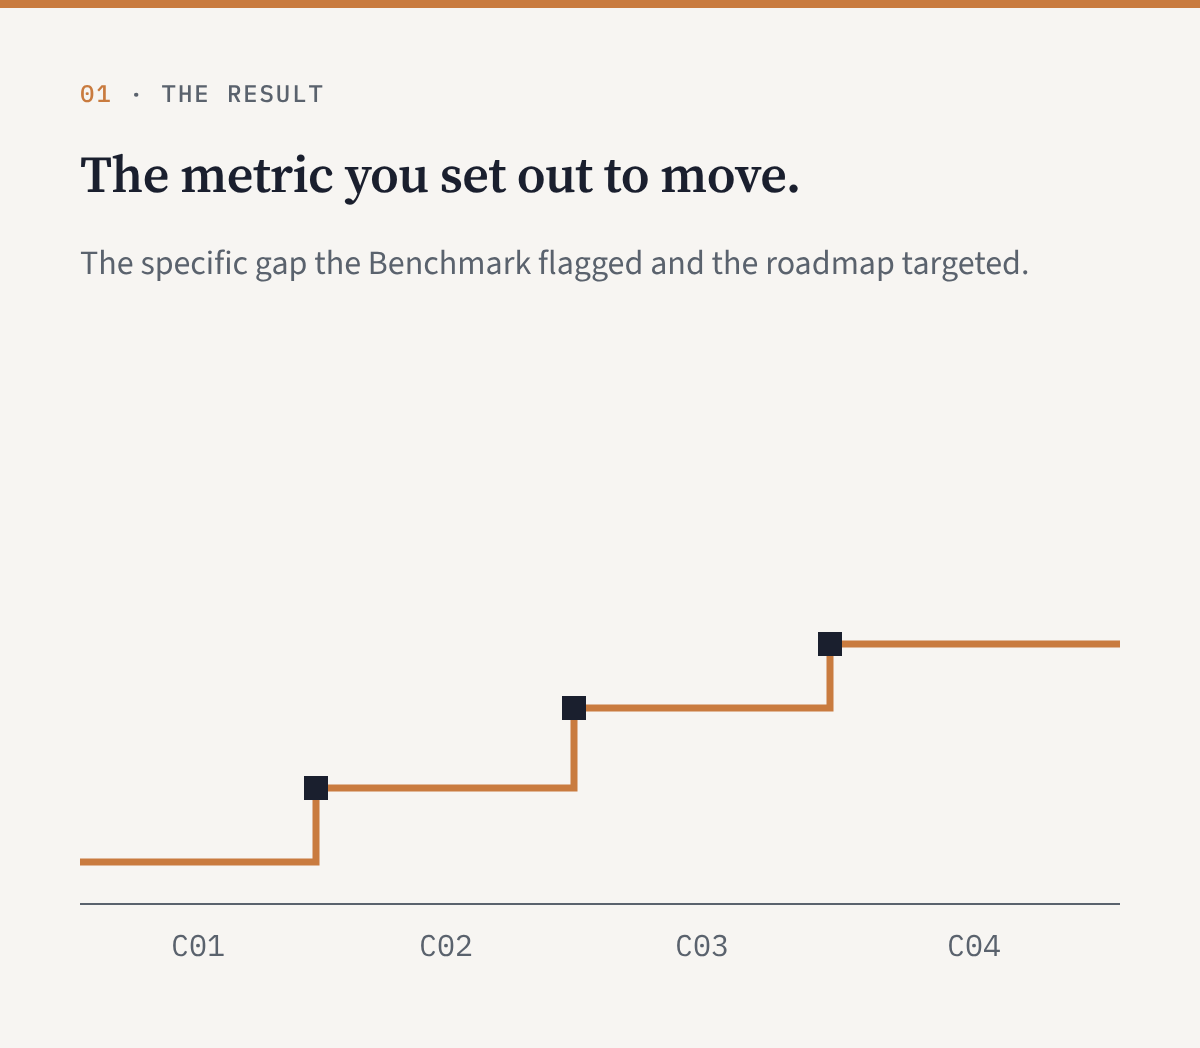
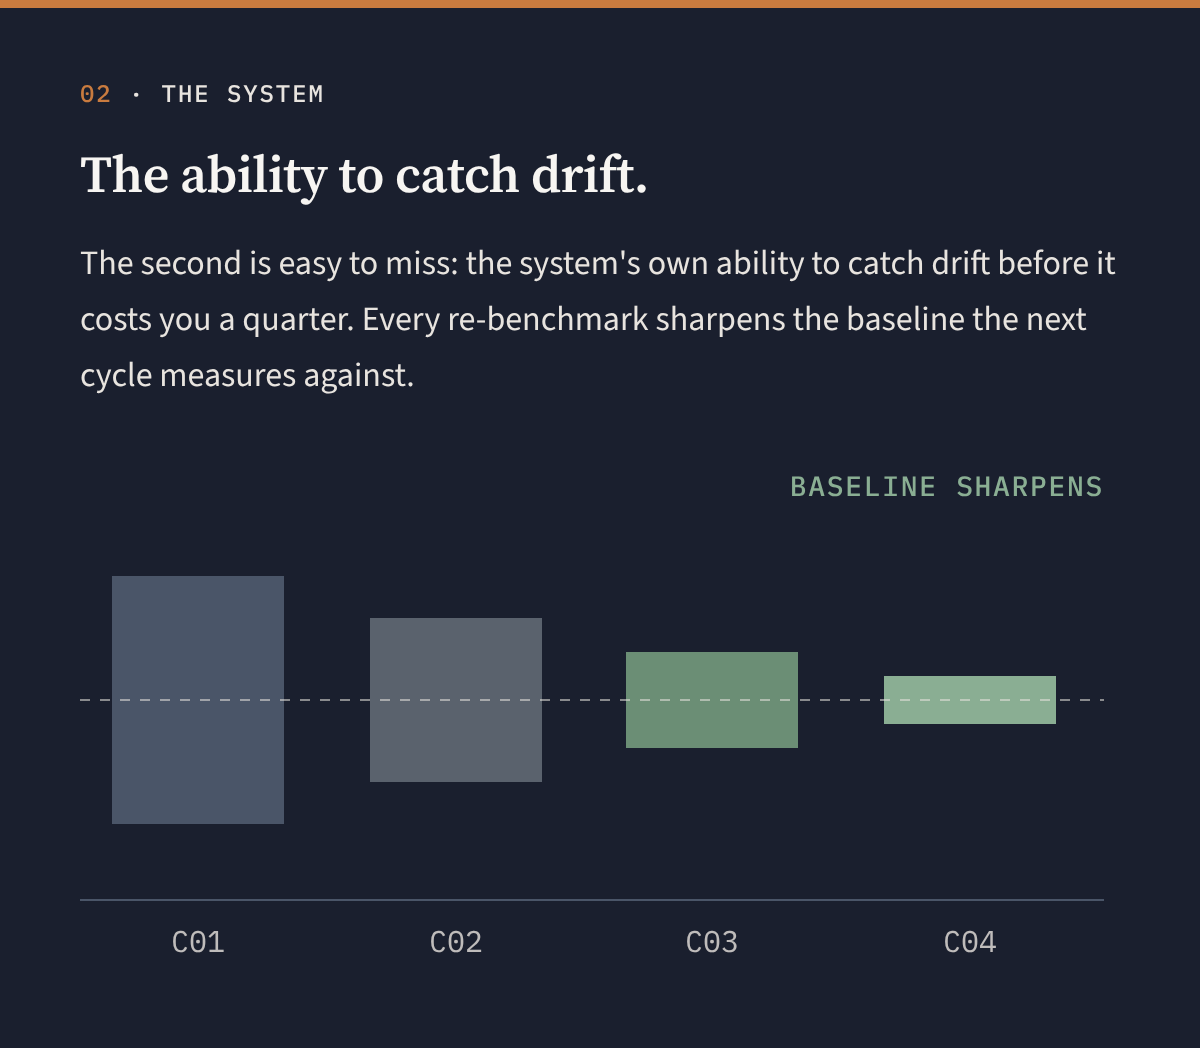
The system gets better at producing growth as you run it.
What you're probably thinking.
We already do QBRs.
QBRs review outcomes. Governance reviews the system that produced them. One tells you the quarter was bad. The other tells you why the next one will be.
We have dashboards.
Dashboards show what happened. The Engine decides what to do about it.
We have tried operating cadences.
They fade. They fade because they were not tied to a benchmark and a playbook. The Engine gives the rhythm something to measure against and something to leave behind.
The team is already stretched thin.
The Engine reduces noise. Fewer ad hoc meetings. Fewer status updates. Fewer initiatives started and abandoned. More cycles completed.
How fast do we see results.
Most clients see revenue impact in the first 100 days. The bigger shift is that after three or four cycles, the team stops debating whether the system works and starts optimizing it.
Your growth potential, before you spend a dollar.
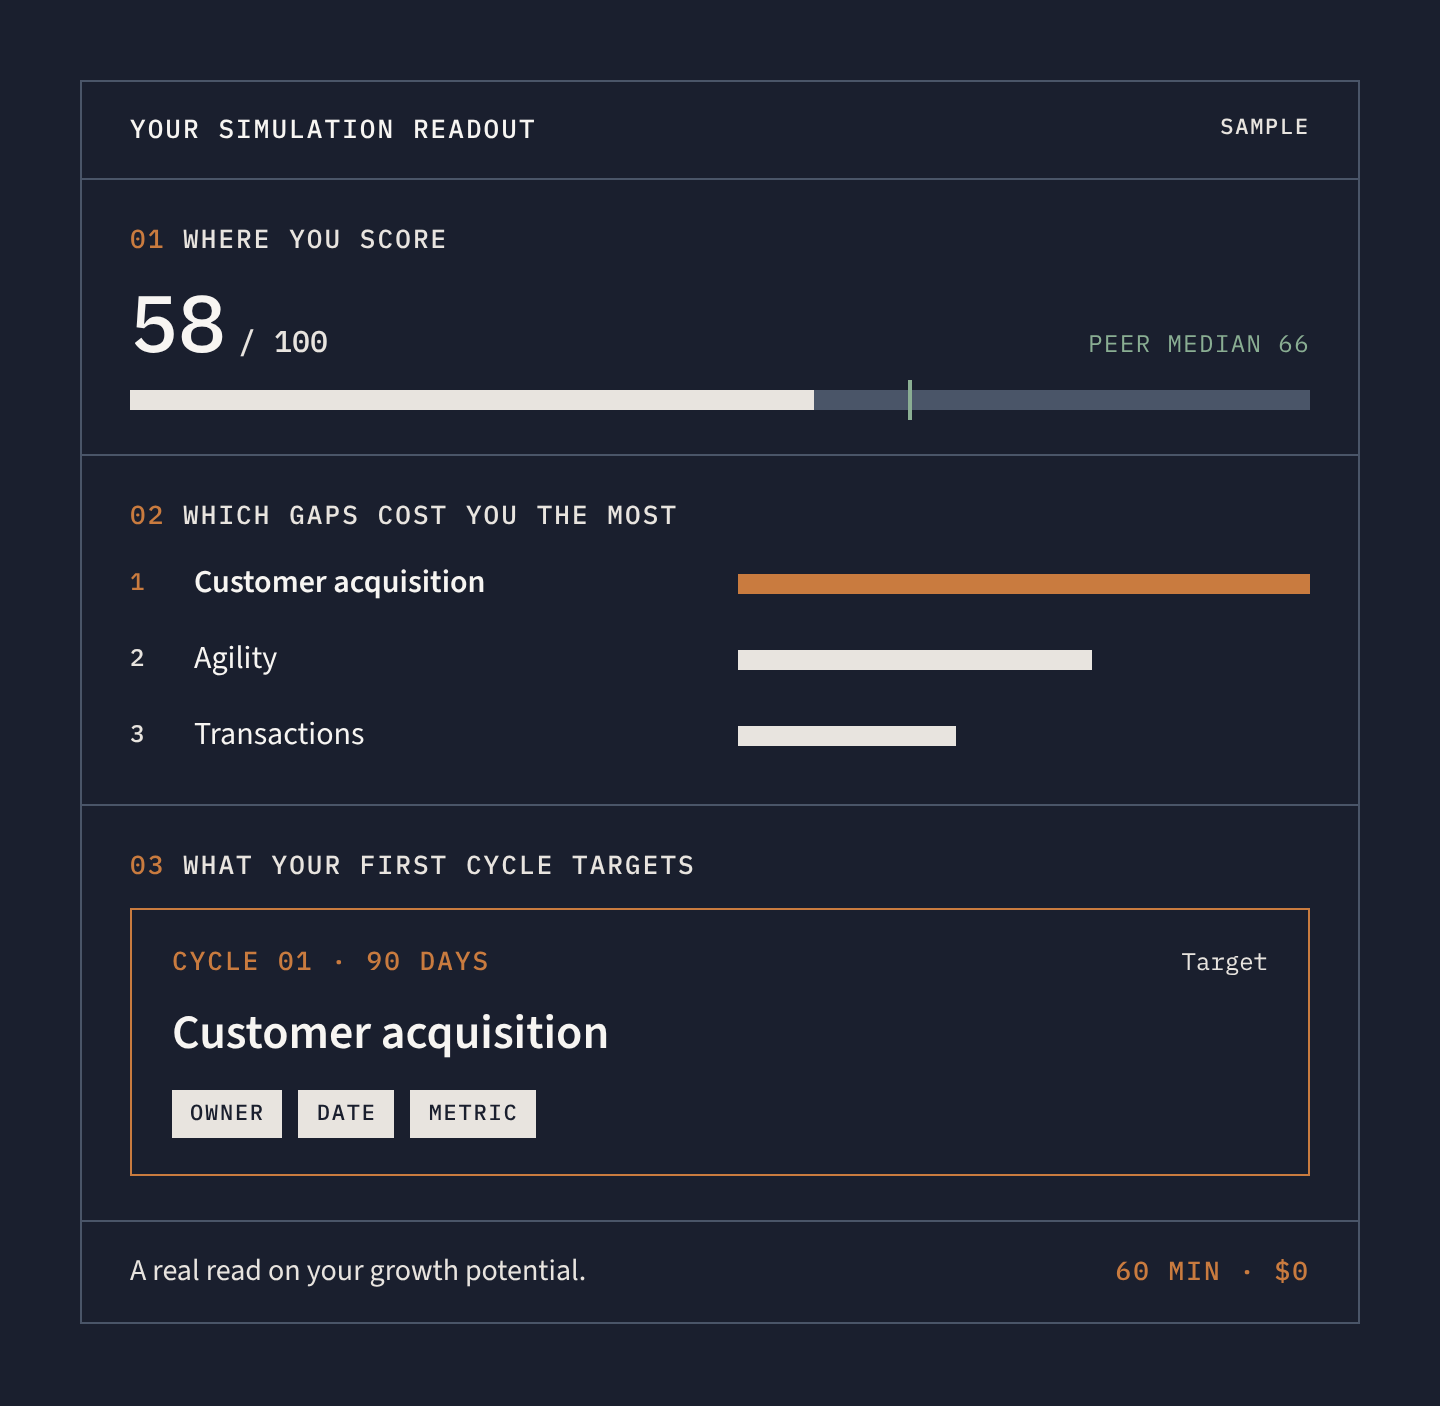
The RevGrowth Simulation is a free, one-hour working session. We run your data through the RevGrowth Benchmark and show you where you score, which gaps cost you the most, and what your first cycle would target. You leave with a real read on your growth potential.
If the Engine is not the right answer for you, we will say so in the same hour.
One free hour · Your data · Zero cost