
The RevGrowth Operating System
The operating system for predictable, sustainable growth.
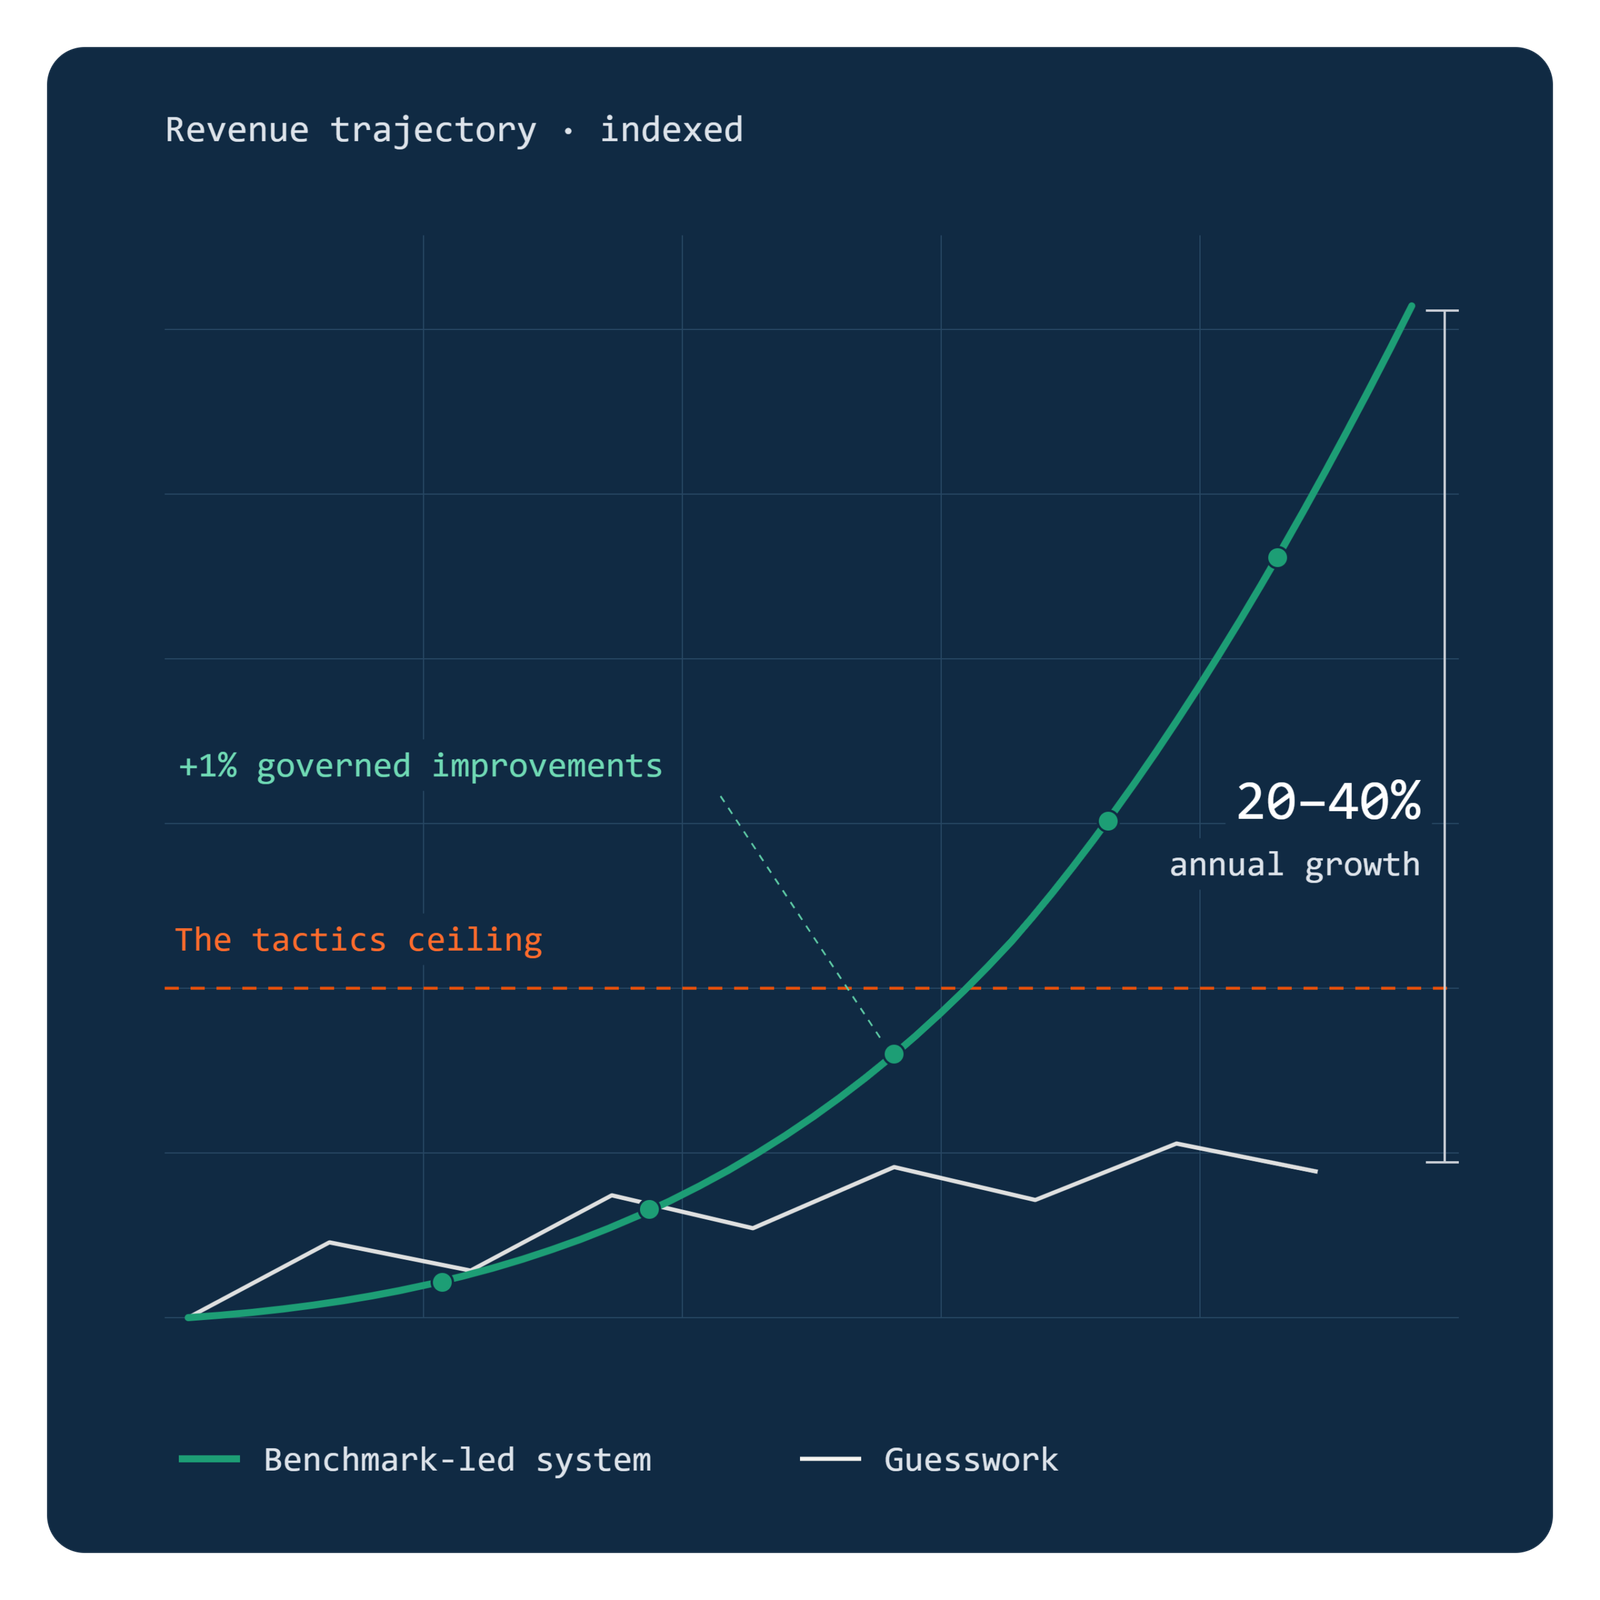
A governed, benchmark-driven system for mid-market industrial and B2B companies that turns a few strategic 1% improvements into 20-40% annual growth in revenue, profits, and enterprise value.
One hour. Your data. Zero cost.
Data-Driven
Every decision rests on evidence – your numbers, measured against external benchmarks.
Accountable
Every metric has an owner. Every owner has a plan.
Repeatable
When success is documented and reproducible, growth compounds instead of starting over each quarter.
Sustainable
The ultimate growth goal: year-over-year double-digit, compounding growth.
Why is sustained growth so difficult for so many companies?
Because the systems that got you to $10M won't get you past it. Early growth runs on founder instinct and informal process - and it works, because everyone is close to the customer. But complexity grows geometrically while informal systems stay flat. That gap is where growth stalls.
No defined stages, no exit criteria — so every rep runs their own process. Forecasts become fiction, not from carelessness, but because "qualified" means something different to everyone.
Marketing is paid on leads, sales on bookings, success on retention. Everyone optimizes their own metric — so the handoffs between teams, where revenue is actually won or lost, belong to no one.
Turn strategy, innovation, brand, and leadership into measurable, repeatable strengths that compound into lasting advantages.
Most companies only compare themselves to their own past. When last quarter is your only reference point, you can't tell whether a 20% win rate is excellent or alarming - so teams mistake activities for progress.
The root cause isn't your strategy, your people, or your effort. You're running a $100M ambition on a $10M system.
Why an operating system - not another strategy?
Every company has a growth strategy. What most are missing is the layer underneath: the operating system that determines whether the strategy actually executes.
An operating system doesn't decide what you do. It governs how things run — how work moves through stages, how decisions get made, how performance gets measured and improved. Every company that scales builds this layer, whether they call it that or not.
An effective one does four things:
01
It's data driven.
Decisions rest on evidence - pipeline data, benchmarks - not the loudest voice in the room. That makes them correctable: when the data changes, the decision changes.
02
It's accountable.
Every metric has one owner; every owner has a forum where results get reviewed. Accountability isn't pressure - it's clarity about who moves which number.
03
It's repeatable.
Wins become documented process, reproducible by the next rep, the next quarter. That's the difference between a good quarter and a good company.
04
It's sustainable.
The system carries the load, so growth doesn't depend on heroics. Pace becomes something you can compound instead of something that burns your team out.
Strategy answers "what will we do to grow?" An operating system answers "how will we do it - predictably, quarter after quarter." Most growth problems that look like strategy problems are operating system problems.
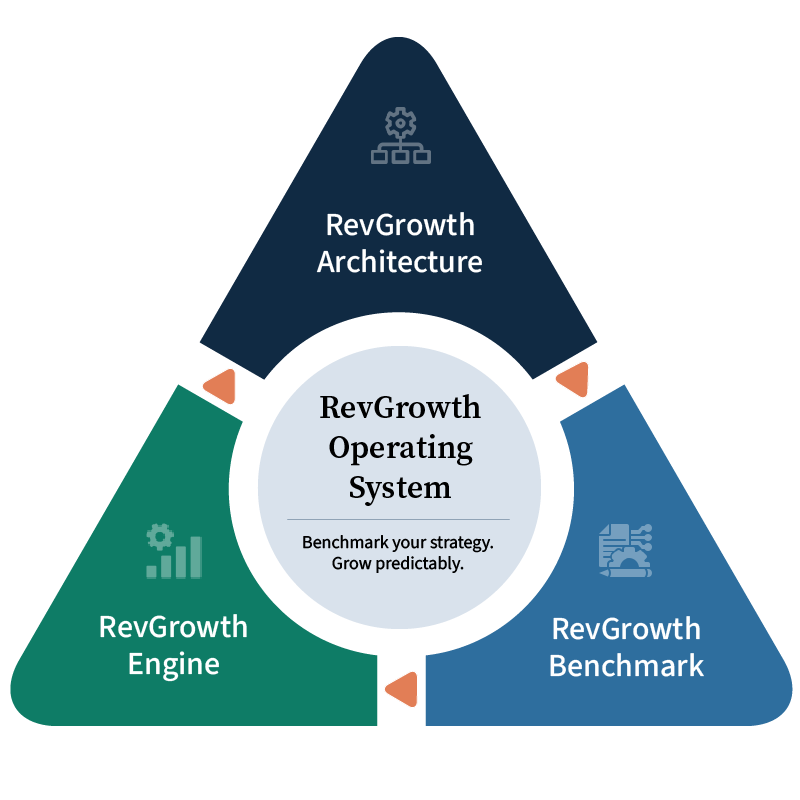
The RevGrowth Operating System: three components, one integrated method.
The RevGrowth OS installs that governance layer in your business through three components that work in sequence — diagnose, design, operate. Here's what each one actually does.
What it is: A governed blueprint for how your growth engine should operate. It has 4 non-negotiables, 11 critical factors, and 37 drivers of sustained growth. Each driver defined with objectives for each stage and ownership for each metric. All aligned with the goal of creating and sustaining growth.
How it works: Using your specific growth goals, we design the operating structure for your specific business - your sales motion, your deal complexity, your team. That includes the stage definitions that stop pipeline leaks, the shared metrics that dissolve silos, and the governance rules that make decisions consistent and auditable.
Why it's effective: Architecture converts individual knowledge into institutional capability. When the process lives in the system instead of in someone's head, it survives turnover, scales with headcount, and improves with use. This is how founder instinct becomes company muscle.
What it is: An objective, data-driven assessment of your entire growth engine — team alignment, process maturity, metric governance — scored against mid-market B2B standards.
How it works: We analyze your actual revenue data and operating practices, then score every dimension against benchmark ranges, from poor to best practice. The output is a map: where you're at or above standard, where you're leaking revenue, and which gaps cost you the most.
Why it's effective: Diagnosis before prescription. Most growth initiatives fail because they fix the visible symptom instead of the binding constraint. The Benchmark finds your actual constraint — so investment goes where the data says, not where the noise is loudest.
What it is: The operating cadence that turns the blueprint into daily behavior. Each with a set agenda, an owner, and decision rights.
How it works: The Engine runs on a simple loop: measure against the benchmark, find the gap, make a governed decision, execute, re-measure. Every cycle either confirms the system is working or tells you exactly what to adjust. Nothing drifts because everything is reviewed on a schedule.
Why it's effective: Systems decay without cadence - it's why most process initiatives fade within two quarters. The Engine is the forcing function that keeps the architecture honest. And because it re-benchmarks continuously, it doesn't just maintain performance. It compounds it.
Architecture defines where you're going. Benchmark tells you where you are. Engine gets you there - and keeps you there.
Each component feeds the next, and the loop repeats itself. That's what makes growth predictable instead of accidental.
What changes when you run on the RevGrowth Operating System?
Because each outcome below is produced by a specific mechanism in the system, these results are engineered - not hoped for.
Defined stages with exit criteria mean every driver meets the same standard - so coverage and forecast numbers reflect reality.
Produced by: Architecture + Engine
Shared metrics align marketing, sales, and customer success around a single growth motion. Momentum carries across the funnel instead of dying between silos.
Produced by: Architecture
External benchmarks plus your own trended data replace opinion-driven debate. You'll know which investments compound - and which just consume budget.
Produced by: Benchmark + Engine
The system carries the operational load so your best people stop firefighting and start building. Repeatable process makes sustainable growth possible.
Produced by: the full operating loop
Investors see a governed, benchmarked growth engine with auditable decisions - not a collection of anecdotes. That credibility compounds, too.
Produced by: Architecture + Benchmark
RevGrowth OS by the numbers...
3-7X
Companies with high RevGrowth Benchmark scores outgrow those with low scores.
74%
See revenue impact in the first 100 days.
34%
Average annual growth identified during the typical RevGrowth Catalyst.
31%
Average marketing budget saved through RevGrowth Benchmark.
10:1
Minimum ROI identified by an action plan created by the RevGrowth Benchmark.
37%
Reduction in time between strategic planning and tactical execution.
"Amateurs talk strategy. Professionals talk logistics."
General Omar Bradley (General of the Army and first Chairman of the Joints Chiefs of Staff)
While strategy and tactics are important, the planning and execution of support systems is the foundation of sustained success. It ensures the right people, tools, and resources are in place at the right time to execute those tactics.
Without reliable logistics, your team can't sustain operations, and even the most brilliant strategies can fail.
The RevGrowth Operating System is infrastructure - not another strategy.
You don't need to abandon what's working. The RevGrowth Operating System doesn’t compete with what you already have - it's the governance layer that makes your strategy and tactics execute better.
Outbound, inbound, product-led, channel, account-based - whatever motion drives your growth today, RevGrowth OS gives it structure, measurement, and accountability. And when your strategy evolves (it will), the operating system evolves with it: the Benchmark re-measures, the Architecture adapts, the Engine keeps running. Strategies change. Infrastructure endures.
Your strategy is what you'll do to grow. Your operating system is how you'll do it - predictably, quarter after quarter.
Discover your growth potential - in just one hour.
The RevGrowth Simulation is a working session built on your numbers. We map your growth strategy, score it against your peer set, and simulate two futures side by side: your current trajectory, and your potential trajectory.
You leave knowing where your ceiling is and what breaking through is worth - in dollars, not adjectives. Your own numbers will show you where your next 20–40% is hiding.
And if the simulation finds no meaningful ceiling? We'll tell you that too - and you'll have the benchmark to prove it.
One hour. Your data. Zero cost.