
RevGrowth Simulation
Discover your growth potential - in one hour.
The RevGrowth Simulation runs your own numbers through the RevGrowth Benchmark and scores your growth engine against 200+ mid-market industrial and B2B companies.
You bring your data. We bring 200+ companies to compare it against. In sixty minutes, you see which parts of your growth engine are performing at peer standard, which are holding the rest back, and what the gap between them is worth in revenue, profit, and enterprise value.
No invoice, and no proposal waiting at the end of it.
A working session with your data - not a sales pitch.
What It Is
It's a working session, not a sales call.
Most first meetings are a company describing itself to you. This one runs the other direction.
We run the RevGrowth Benchmark on your business, live, in compressed form. The difference is scope, not rigor: one hour instead of a full day.
We won't diagnose your business in an hour. Nobody can. What we'll do is size the gap, in the terms your board already uses.
You get to see what growth looks like when it is actually engineered.
4 non-negotiables
7 critical factors
25 growth drivers
What We Do
Discover your growth potential - in one hour.
YOUR DATA
First 15
We review your numbers and Growth Predictability Score results.
REVGROWTH FRAMEWORK
Second 15
We show you what growth engineering actually looks like.
YOUR POTENTIAL
Final 30
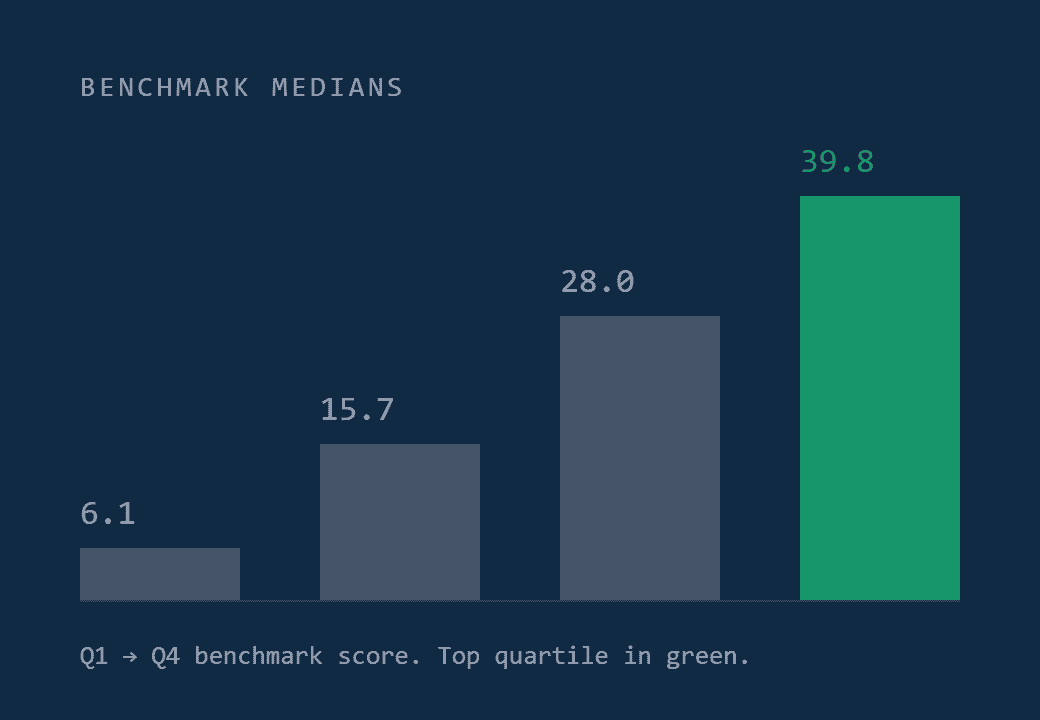
We run the simulation and size the gap: what your numbers look like if you move your benchmark score to top-quartile performance, and what that compounds to over three years.
The Deliverable
The RevGrowth Impact Summary
A two-column view of your business: current state beside the state your own data says is available to you. Current CAGR beside achievable CAGR. Current revenue beside projected revenue. The same for profit and enterprise value, with a three-year return on the work required to close the distance.
It's built to be forwarded, and it's yours whether or not we ever work together.
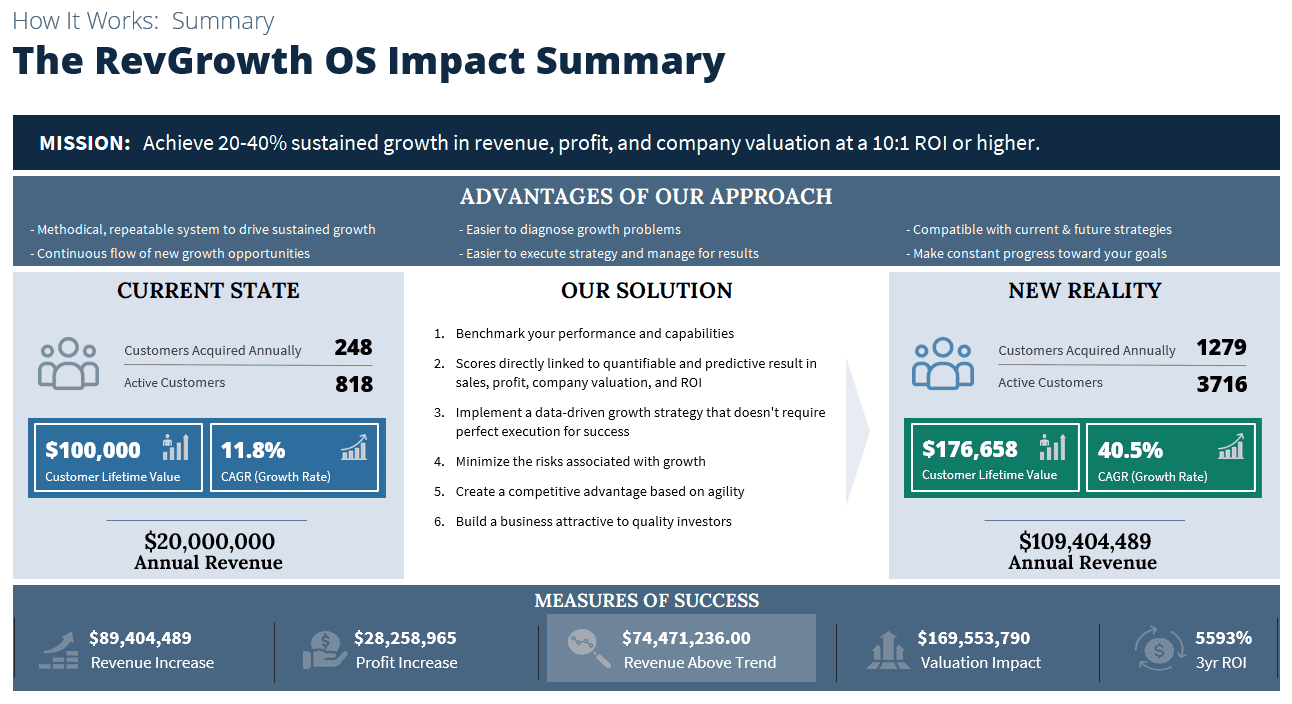
The right-hand column isn't a forecast.
Projections are easy to produce and easy to dismiss. Your CFO has seen a hundred of them.
The New Reality column is what companies in the top quartile of our benchmark set actually achieve - 200+ mid-market industrial and B2B companies, measured across the same 25 drivers.
We're not showing you what we think you could do. We're showing you what your numbers look like at a performance level companies your size have already reached.
The difference between a forecast and a benchmark is that others have already done it.
What We Need From You
Your numbers and an honest hour.
FIRST
Directionally right is enough to see the potential.
SECOND
The Growth Predictability Score
Complete the Growth Predictability Score assessment on our site. It takes about ten minutes, and it gives you a good idea of what we do and how we work.
Nothing gets audited. If your numbers are directionally right, so is your benchmark - and the sharper your inputs, the sharper the result.
Why It Costs Nothing
Why we don't charge for this.
Growth strategy benchmarking is difficult to explain and simple to demonstrate. It is also the fastest qualification tool we have. In an hour, we both find out whether the potential is great enough to be worth anyone's time.
The RevGrowth Simulation sizes the gap. It doesn't explain it. Explaining it takes the full RevGrowth Benchmark. If the Impact Summary makes a strong case, that's the next step. If it doesn't, you'll know inside an hour and we'll both save time.
Some sessions end with a clear path forward and a conversation about the next step, the RevGrowth Catalyst. Others end with a summary and a handshake. Both are fine outcomes. The dataset gets stronger either way.
One thing to expect: calculating return requires knowing what the work costs, so you'll see engagement economics during the hour. There's still no deck and no proposal.
That's arithmetic, not a pitch.
Who It's For
Built for one kind of company.
A FIT
Mid-market industrial and B2B: manufacturers, distributors, and services firms between $10M and $500M in revenue. Companies with a real business, a real ambition, and a gap between the two.
NOT A FIT
Pre-revenue, venture stage, in turnaround, or under $10M. The RevGrowth Benchmark set doesn't contain companies like that, so the second column wouldn't mean anything.
Who's in the room
CEO - Required
CFO- Requested
+1 - Optional
The CEO has to be there, and bring the CFO - the second column is written in their language. A third person could be the CRO if you have one, a board member, or a large stakeholder. Past three people it stops being a conversation and starts being a presentation.
Presentations don't decide anything.
Before The Session
Get your Growth Predictability Score first.
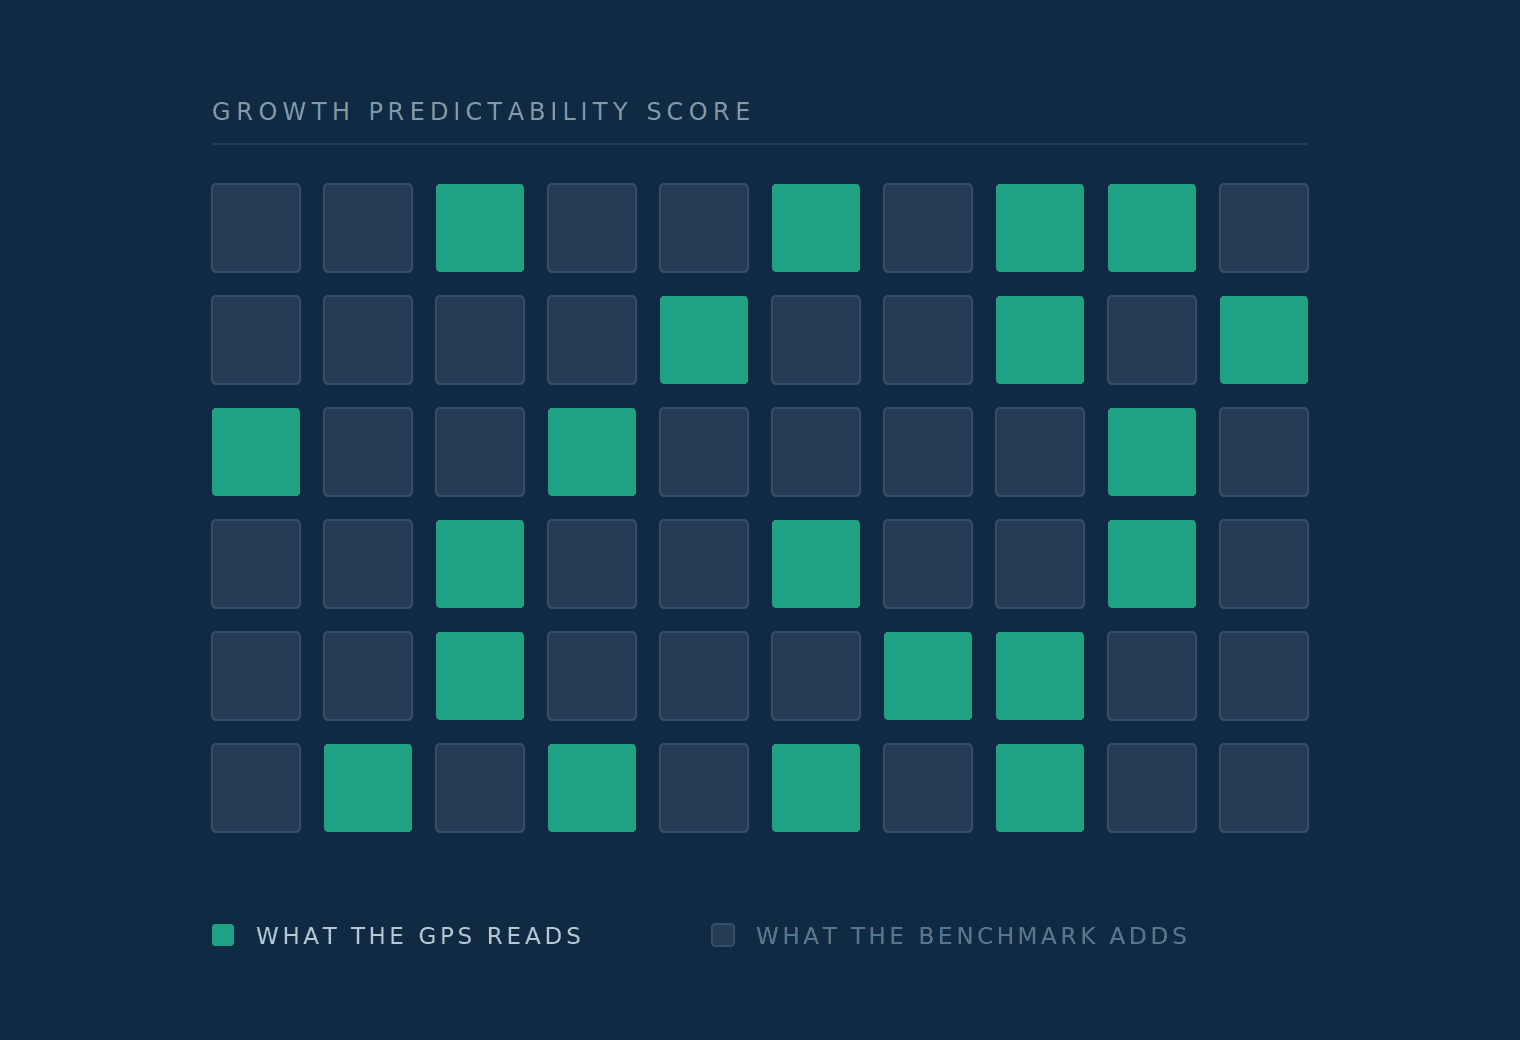
A free online assessment that gives you a score in a few minutes and a preview of how the RevGrowth Benchmark reads a business. Roughly a third of the questions we'd ask in the session. Bring it to the Simulation and we start further down the field.
FAQ
Common questions about the RevGrowth Simulation
Is this a sales pitch in disguise?
No. It's an opportunity for you to sample the RevGrowth Operating System and see it in action. This is the best way to see for yourself if it is relevant to your business and goals. There is no deck and no proposal. If we think there's a fit, we'll ask for a second conversation at the end. You can say no and keep the Impact Summary.
Do I have to take the assessment first?
Yes. The Growth Predictability Score is what makes the hour worth having. Without it, we'd spend the whole session on questions you could have answered in ten minutes at your desk.
Our data is messy.
Everyone's data is. The RevGrowth Simulation is more accurate with accurate numbers, but it also runs on ranges and estimates as well. Precision matters at the RevGrowth Benchmark stage, not here.
We're already growing.
Then the RevGrowth Simulation tells you whether that's your system or your market. Companies riding a tailwind (11.8% growth for industrials in 2025) and companies with an engine may look identical on a revenue chart, but they will look completely different on the RevGrowth Benchmark. The distinction only becomes obvious when the tailwind stops, and by then it's expensive.
How is this different from the RevGrowth Benchmark?
The RevGrowth Simulation is one hour and sizes the gap. The Benchmark is a full day, uses your actual operating data across all 37 drivers, and explains it. Simulation tells you what's available. Benchmark tells you how to get it.
Who should be in the room?
The CEO is required. The CFO is requested. An additional person can be the CRO, head of marketing or sales, or a board member. Operating partners are welcome and usually ask the sharpest questions.
One hour. Your data. Zero cost.
Schedule your RevGrowth Simulation
Tell us where to reach you and roughly what size the business is. We confirm a time within one business day and send a short list of the numbers to have on hand.
What happens next:
01 - We confirm fit in two questions over email.
02 - You pick a time and send whatever figures you have.
03 - One hour together, and the RevGrowth Impact Analysis is yours to keep.