
The Growth Benchmark Blog
The 4-7-25 structure explained.
by Russ Holder
Founder & CEO
RevGrowth OS, LLC
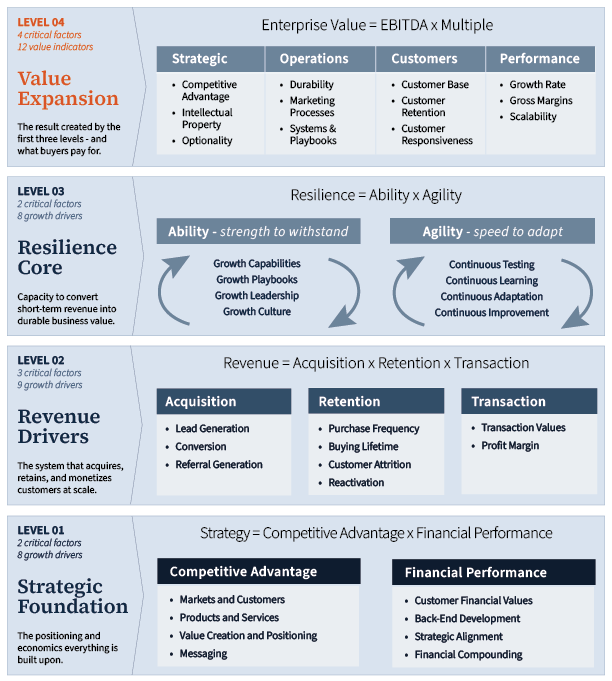
You see it everywhere on this site: 4 non-negotiables, 7 critical factors, 25 Drivers. It is not a tagline. It is the structure of the RevGrowth Architecture. This design is intentional. The cascade connects each level, so the Benchmark can give you one clear score and twenty-five specific actions, all linked together.
The Shape of Architecture
Start at the top. There are four levels. These are called non-negotiables for a reason. They are not optional features. They are the conditions every company needs to grow, in a fixed order.
Strategic Foundation — Strategy = Competitive Advantage × Financial Performance. What you're actually good at, multiplied by whether that advantage shows up in the numbers.
Revenue Drivers — Revenue = Acquisition × Retention × Transaction. How you get customers, keep them, and grow what each one is worth.
Resilience Core — Resilience = Ability × Agility. Whether the organization can execute the plan and adjust it when conditions change.
Value Expansion — Enterprise Value = EBITDA × Multiple. What the business is worth once the first three levels are actually working.
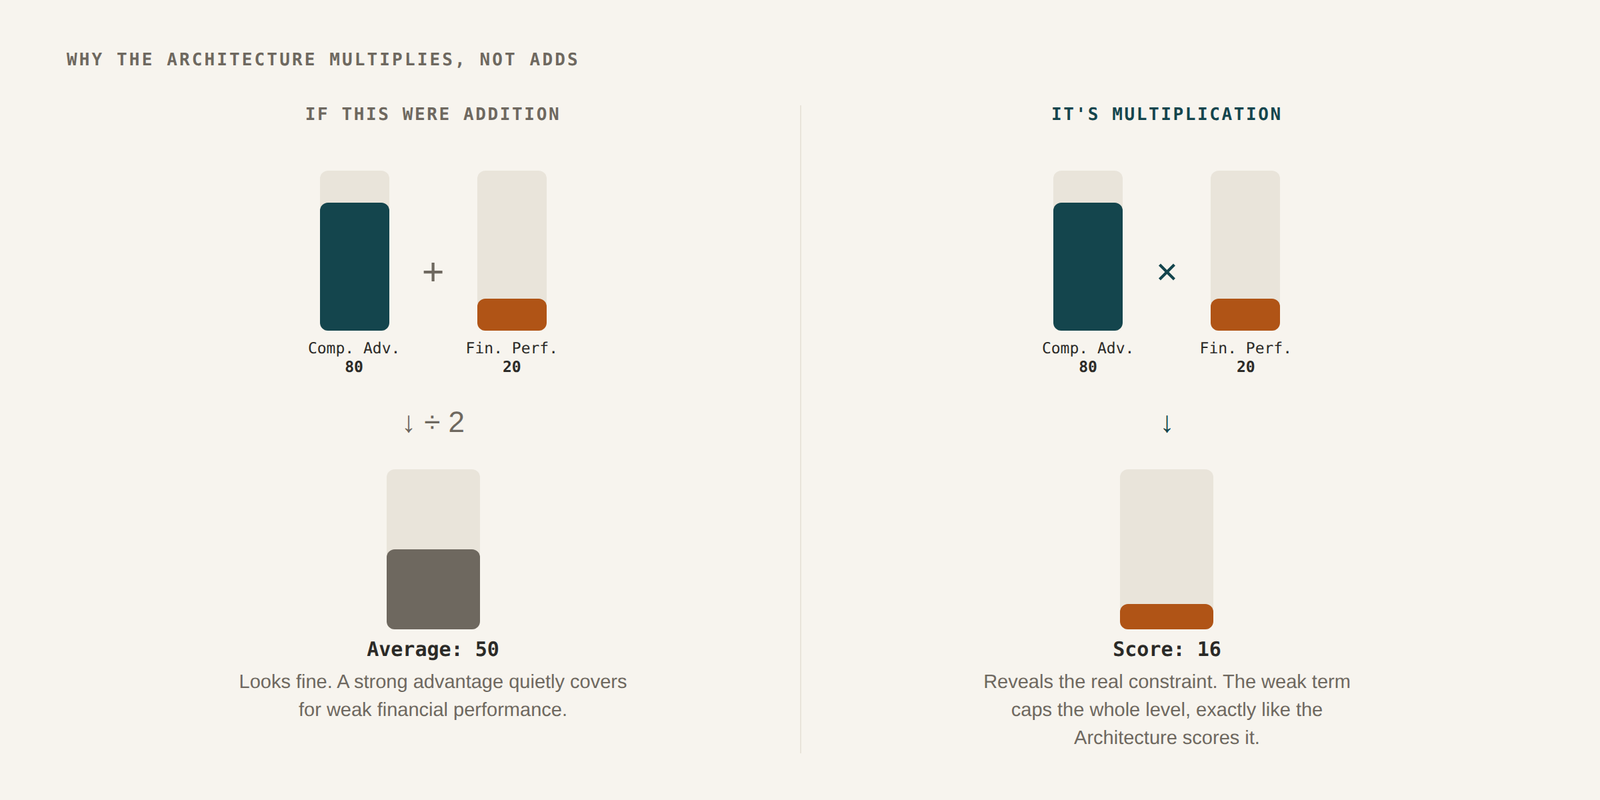
Each level multiplies, not adds. If a company excels at Acquisition but is weak at Retention, the result is not an average. The weakest term limits the outcome. This is not just a detail. It is why one weak factor can cap your score, even if everything else is strong. This is what sets this model apart from generic maturity models.
The 7 Critical Factors
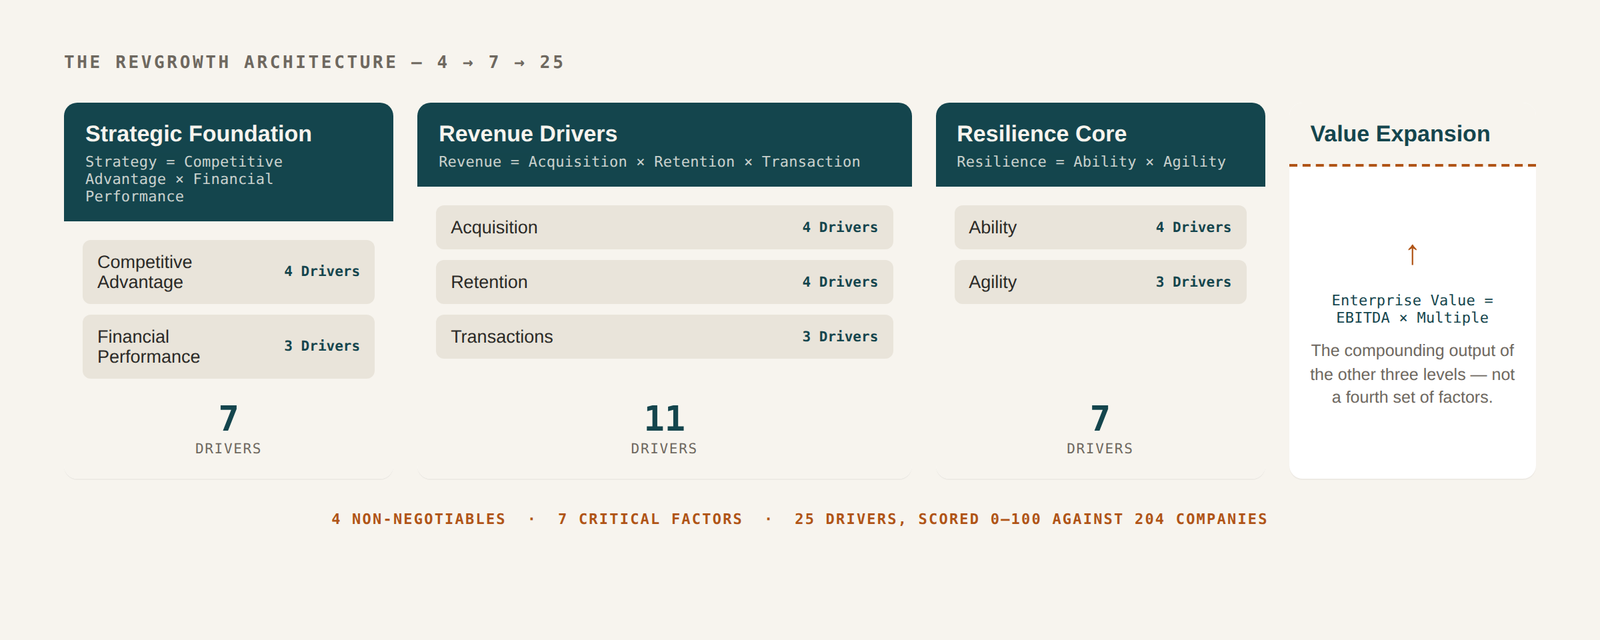
The four levels are not measured directly. Each is measured through the factors below it. There are seven in total. Here is where each onefits:
Strategic Foundation breaks into two: Competitive Advantage and Financial Performance.
Revenue Drivers breaks into three: Acquisition, Retention, and Transactions.
Resilience Core breaks into two: Ability and Agility.
That makes seven factors across three levels. Value Expansion does not have its own set of factors. This is intentional. Value Expansion is not an input. It is the output. Enterprise Value results when the other three levels are working. You do not improve Value Expansion directly. You improve the factors that drive it, and the value follows.
The 25 Drivers
Each of the seven factors is still too broad to score directly. Asking about Retention invites opinion. Each factor breaks down into specific, measurable Drivers. There are twenty-five in total. The RevGrowth Benchmark scores these from 0 to 100, using data from 204 companies.
What a Driver looks like varies by factor, but the pattern holds everywhere: something you could pull from a report, not something you'd have to guess at. Under Acquisition, what activities are directly responsible for generating revenue? What about Retention? What can you improve directly that results in gains to financial performance?
This is the level where the Benchmark operates. The 4 and the 7 organize and explain the findings. The 25 Drivers produce the results.
Why It's a Cascade, Not a Checklist
This structure gives you more than a flat list of twenty-five items. Each Driver score rolls up into its factor. Each factor rolls up into its non-negotiable. Every non-negotiable leads to Value Expansion. Every part of the model connects to the top.
This structure lets you give a CEO one number, the overall Benchmark score, and still explain exactly how it was built. If you ask why the score is what it is, the cascade shows which non-negotiable is weakest, which factor is lagging, and which Driver needs attention. A framework with eleven categories and thirty-seven sub-items may look thorough, but it is harder to act on. Without a cascade, every item is equal, with no structure to show what matters most.
4-7-25 isn't a bigger number of things to track. It's a smaller number of levels, each one built to explain the level below it.
Frameworks give you opinions. Benchmarks give you position. The 4-7-25 structure makes both possible in one tool. It is both the map and the coordinates, built from the same twenty-five numbers.
One hour. Your data. Zero cost. Run the RevGrowth Benchmark and see where your own numbers land inside it.
Benchmark your strategy. Engineer your growth.
When you’re ready to see where you actually stand, the RevGrowth Simulation is where this starts – one hour, your own numbers, no cost, and no proposal at the end of it.

The RevGrowth Score
Ten minutes to find out where you actually sit.
The findings tell you what the data says. They don't tell you where you are in it. The RevGrowth Score scores your company against some of the same non-negotiables and critical factors we score every benchmarked company on. Ten minutes, online, no call required.
You get a position, not a grade.
Ten minutes. Online. No call required.
The RevGrowth Simulation
Find out which one you are.
The RevGrowth Simulation is a one-hour working session using your own numbers. You'll see where your growth system sits against 200+ mid-market companies, and what the gap is worth.
60 minutes - built on your data - CEO level - no obligation