
The Growth Benchmark Blog
What 200+ mid-market companies reveal about growth.
by Russ Holder
Founder & CEO
RevGrowth OS, LLC
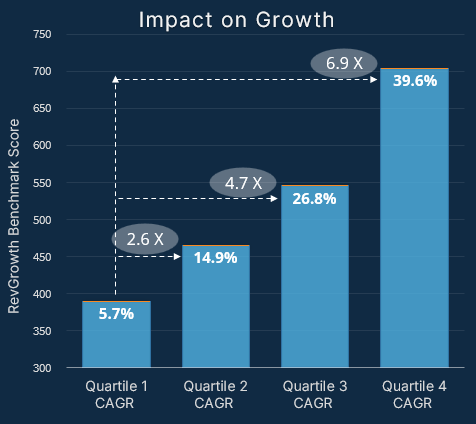
Apply the same instrument to 200 mid-market companies and a clear pattern emerges. This pattern is visible only at scale, not in any single case study. Here is what the data shows.
A Spread That Shouldn't Exist
Sort the 200+ companies in the RevGrowth Benchmark dataset into quartiles by their score against the Architecture, then look at how fast each quartile actually grows. Bottom quartile: 6.1% a year. Second quartile: 15.7%. Third quartile: 28.0%. Top quartile: 39.8%.
Look at the ratio. The top quartile is growing about seven times faster than the bottom. Not twice as fast. Not fifty percent faster. Seven times. These companies are in the same dataset, the same size range, often the same markets, sometimes with a weaker product than their peers.
A spread this large is often explained by stories about leadership, timing, or luck. The data does not support these explanations. The only consistent correlation across all 200+ companies is how closely a company’s growth infrastructure fits the Architecture required for compounding growth.
It Isn't Talent, and It Isn't Luck
This finding reframes the spread. Bottom-quartile companies are not run by poor operators. Most have capable teams that work hard and meet visible goals. What they lack is not ability. They lack a scored, comparative view of their actual position. That is what turns effort into compounding results instead of another year that looks like the last.
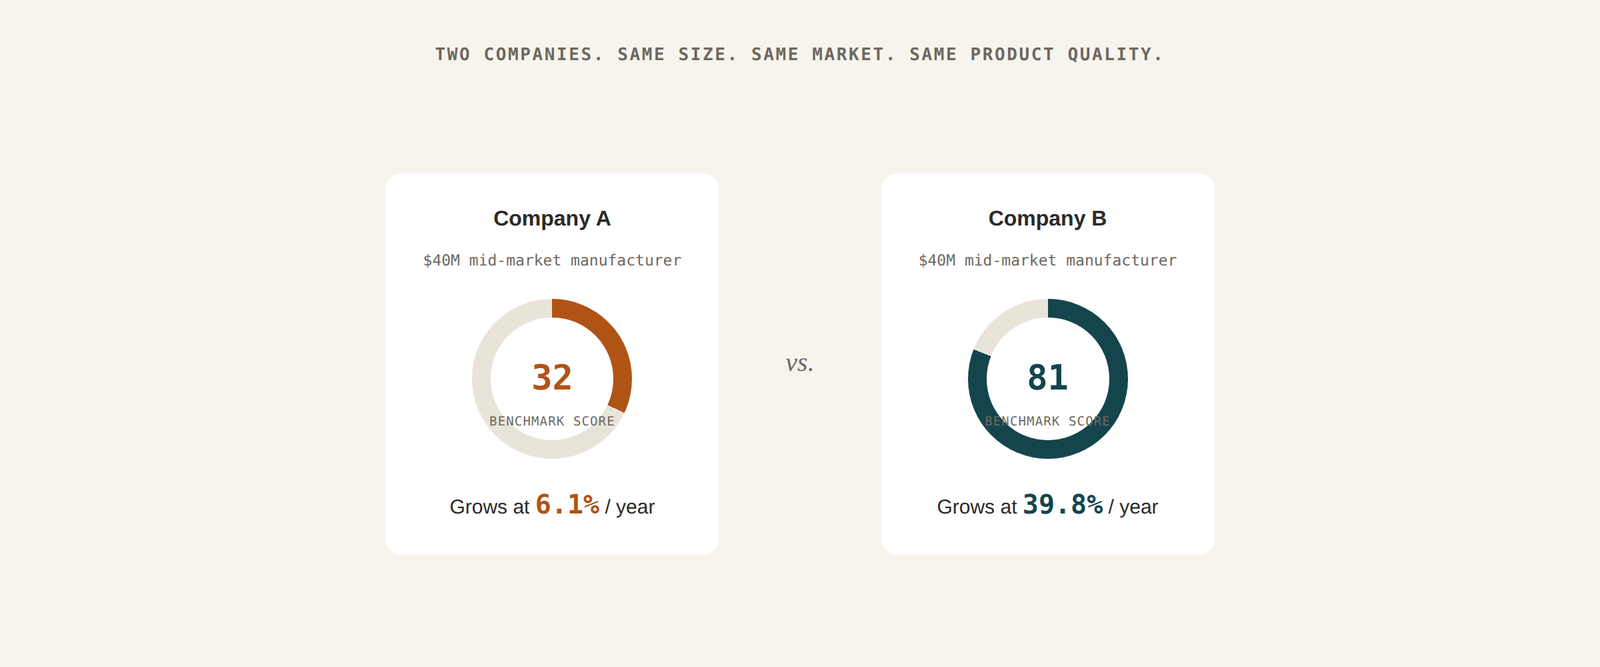
Two companies in the same vertical, with similar resources and talent, can end up seven times apart in growth. The difference is not in the résumé. It is in whether anyone measured the twenty-five specific factors that determine if effort compounds or repeats.
Almost Everyone Already Has a Framework
This often surprises first-time Benchmark users. In almost any of these 204 companies, you will find a strategy deck, stated priorities, and a growth plan. Frameworks are not scarce. What is scarce, before the first Benchmark, is a scored answer to the only question that predicts what happens next: compared to companies already doing this well, where do you stand?
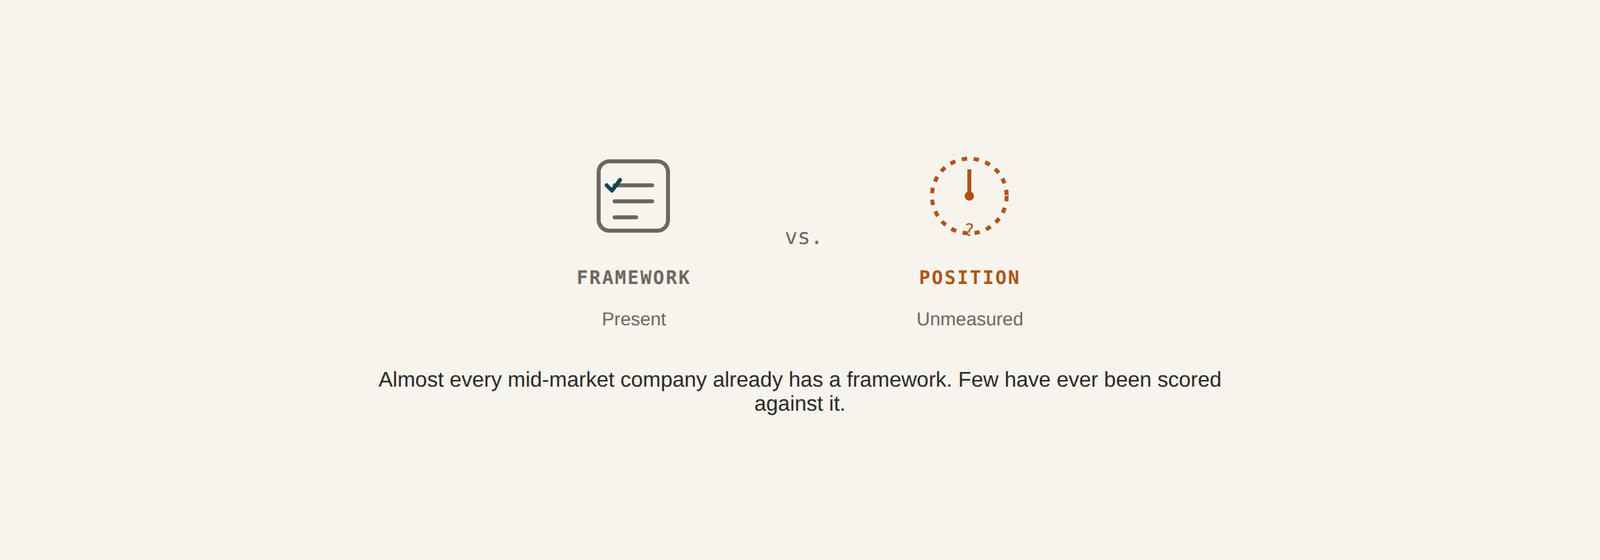
That gap, between having a framework and having a measured position inside it, is nearly universal in the dataset. It is not simply a bottom-quartile problem. Many second- and third-quartile companies had frameworks they trusted and still found real, specific gaps that the framework alone never revealed.
Small Levers, Not One Big Bet
Ask a company what is holding back its growth before benchmarking, and you will usually hear one big, dramatic answer. The sales team. The product. The market. But when you run the actual instrument, the data rarely supports that view.
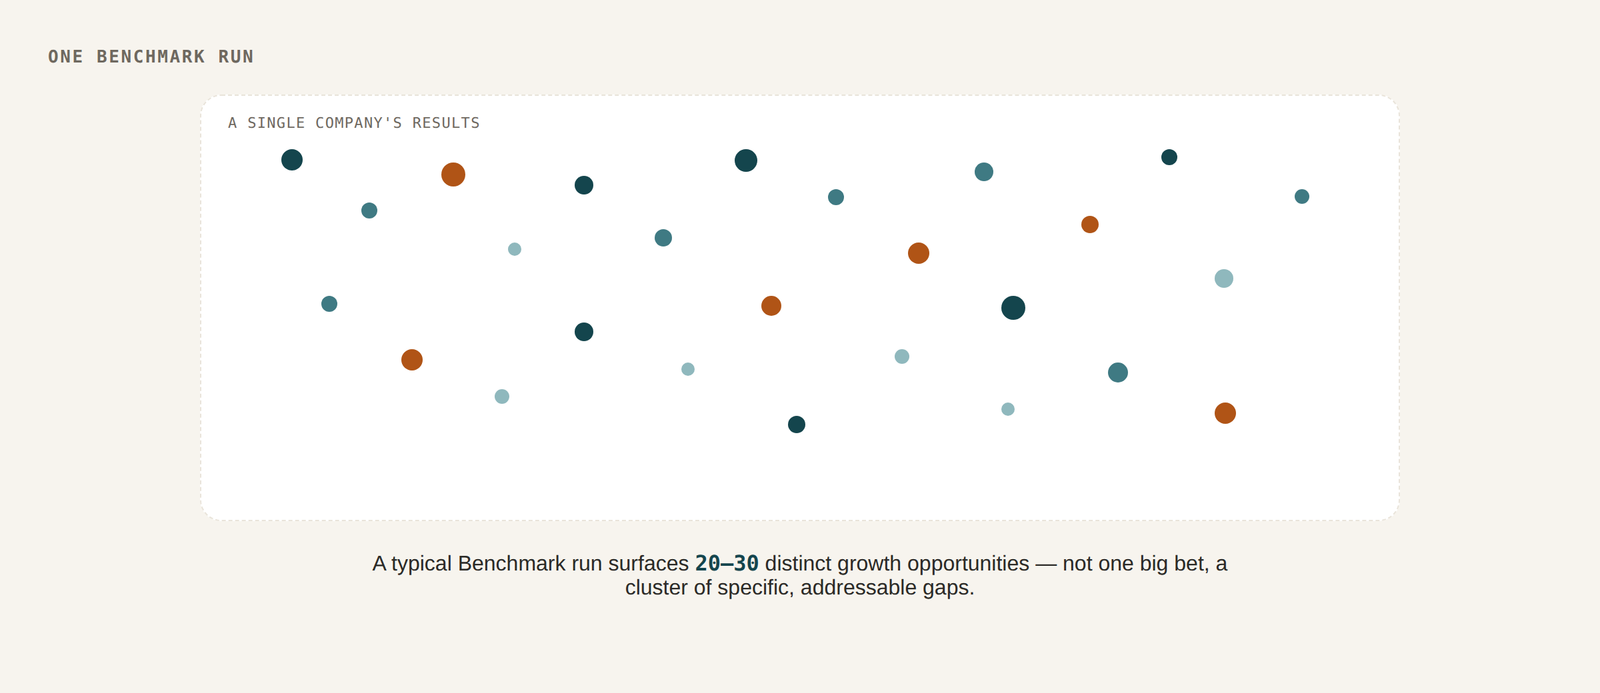
Across the dataset, a typical company finds 20 to 30 distinct growth opportunities in a single Benchmark run. These are not one big fix, but a cluster of specific, addressable gaps across multiple factors. None alone would justify a strategy offsite. Together, sequenced and executed in the right order, they separate a 15.7% grower from a 39.8% one. Strategic 1% improvements, found and stacked, compound into 20 to 40% annual growth. It is not a single swing, but a series of small, correctly sequenced moves.
What This Means for Your Number
None of this tells you which quartile you’re in. That’s the part the dataset can’t answer from the outside — it can only tell you that the range between quartiles is real, repeatable, and has nothing to do with how hard your team is working.
The pattern across 200+ companies shows what is worth checking before you assume you know the answer. The gap between a good year and a compounding one is rarely about talent or market. It is usually a measurement gap. This is the one variable in the spread that you can close in a single hour, using your own numbers.
One hour. Your data. Zero cost. Run the RevGrowth Simulation and find out which quartile your own numbers put you in.
Benchmark your strategy. Engineer your growth.
When you’re ready to see where you actually stand, the RevGrowth Simulation is where this starts – one hour, your own numbers, no cost, and no proposal at the end of it.
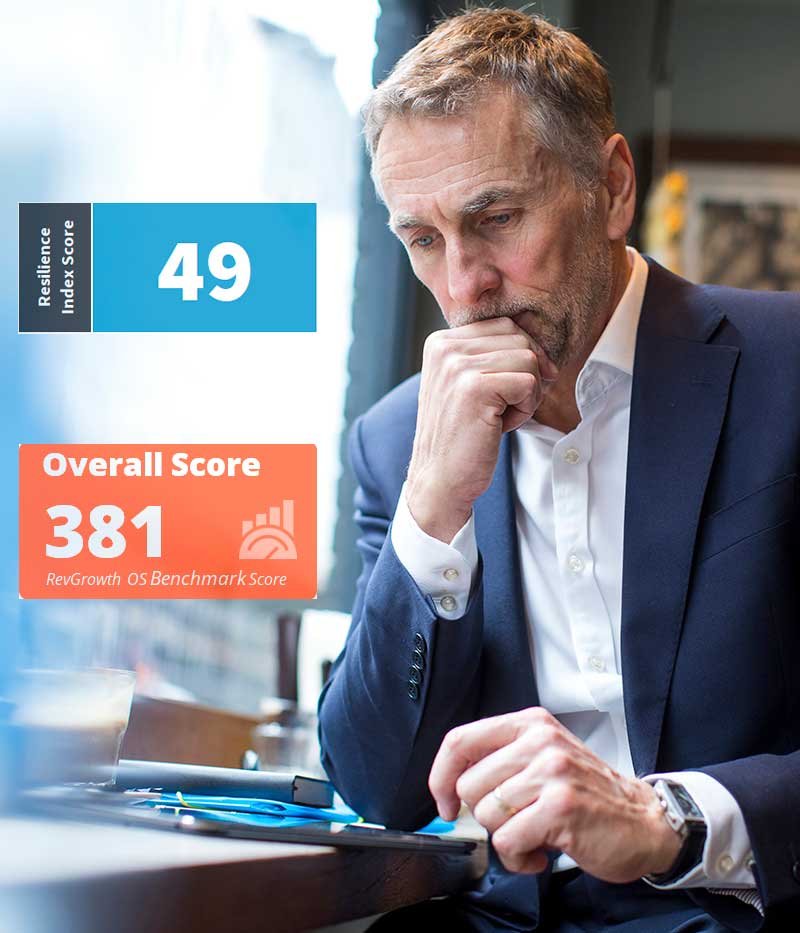
The RevGrowth Score
Ten minutes to find out where you actually sit.
The findings tell you what the data says. They don't tell you where you are in it. The RevGrowth Score scores your company against some of the same non-negotiables and critical factors we score every benchmarked company on. Ten minutes, online, no call required.
You get a position, not a grade.
Ten minutes. Online. No call required.
The RevGrowth Simulation
Find out which one you are.
The RevGrowth Simulation is a one-hour working session using your own numbers. You'll see where your growth system sits against 200+ mid-market companies, and what the gap is worth.
60 minutes - built on your data - CEO level - no obligation