
The Growth Benchmark Blog
Why the Bottom Quartile Has the Most Upside Potential With the RevGrowth Benchmark.
by Russ Holder
Founder & CEO
RevGrowth OS, LLC
Say "bottom quartile" in a boardroom and the reaction is immediate. Someone gets defensive. Someone points a finger. The assumption is clear: bottom quartile means someone failed to do their job.
That assumption is not just wrong; it hides the real opportunity. A bottom-quartile score on the RevGrowth Benchmark is not a verdict on the team. It measures distance from the RevGrowth Architecture standard. On this Benchmark, distance is the one factor that converts directly into upside. The further back a company starts, the more room it has to move.
What "Bottom Quartile" Actually Means
The RevGrowth Benchmark's quartiles are not a performance review. They measure how close a company's growth infrastructure is to the RevGrowth Architecture standard. That standard is defined by 4 non-negotiables, 7 critical factors, and 25 Drivers. These determine whether growth compounds or resets each quarter. A company can have capable, hardworking people and still land in the bottom quartile. The quartile does not score effort. It scores whether that effort runs through a measured, governed system or through instinct.
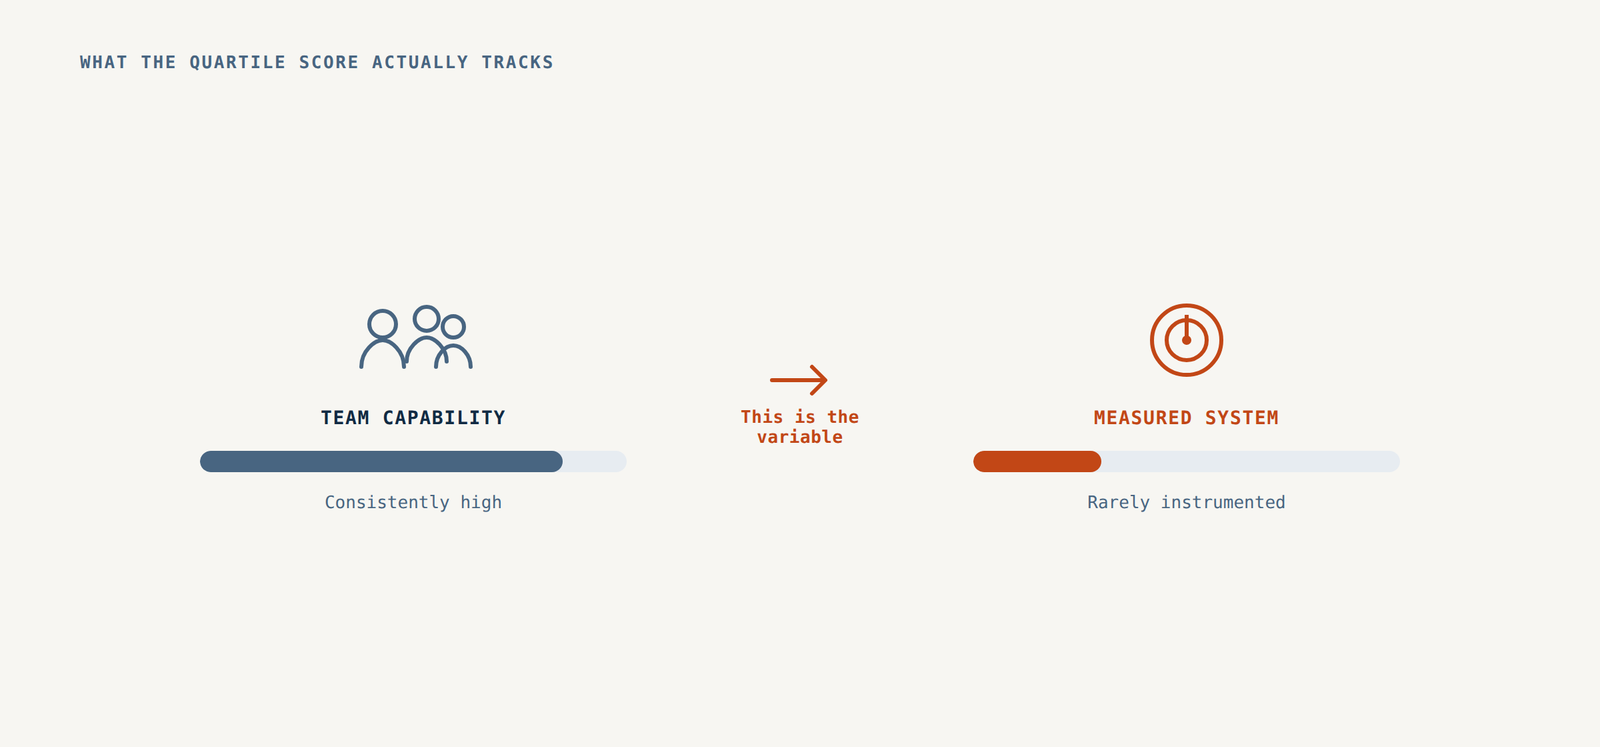
This is why quartile position and upside potential move together. A top-quartile company is already close to the standard. Most of its 25 Drivers are tuned, and the gains left on the table are marginal. A bottom-quartile company has multiple Drivers running well below standard. Each one is a lever nobody has pulled yet.
The Plant Floor Never Had That Problem
You would not make this mistake on the plant floor. If a line's defect rate is high, a good operations leader does not start by asking who is lazy. They do not treat the worst-performing step as a lost cause. Six Sigma measures the process, finds the step producing the most variance, and fixes that step first. The step furthest out of control holds the biggest gain. Everyone on the plant floor knows a strong crew can still get bad output from an unmeasured, unstable process. The process furthest from standard has the most to give back once you fix it.
Growth is usually the one function that does not get this treatment. A sales team can close every deal they are handed and still miss growth targets because lead qualification is broken and unmeasured. A retention team can do everything right on renewal calls and still lose accounts because pricing has never been benchmarked. The team was never the constraint. The absence of instrumentation was. Instrumentation is the one gap that, once closed, pays for itself immediately.
Growth by Heroics is Proof of Latent Capacity
The data shows a clear pattern in bottom-quartile companies. The issue is not less effort. It is effort spent on heroics instead of compounding. A great quarter happens because someone worked eighty-hour weeks to save a key account, or a founder personally closed the deal. It feels like a win. It is actually a signal, and a specific kind of signal. It means the company already has more raw capability than its system lets it use.
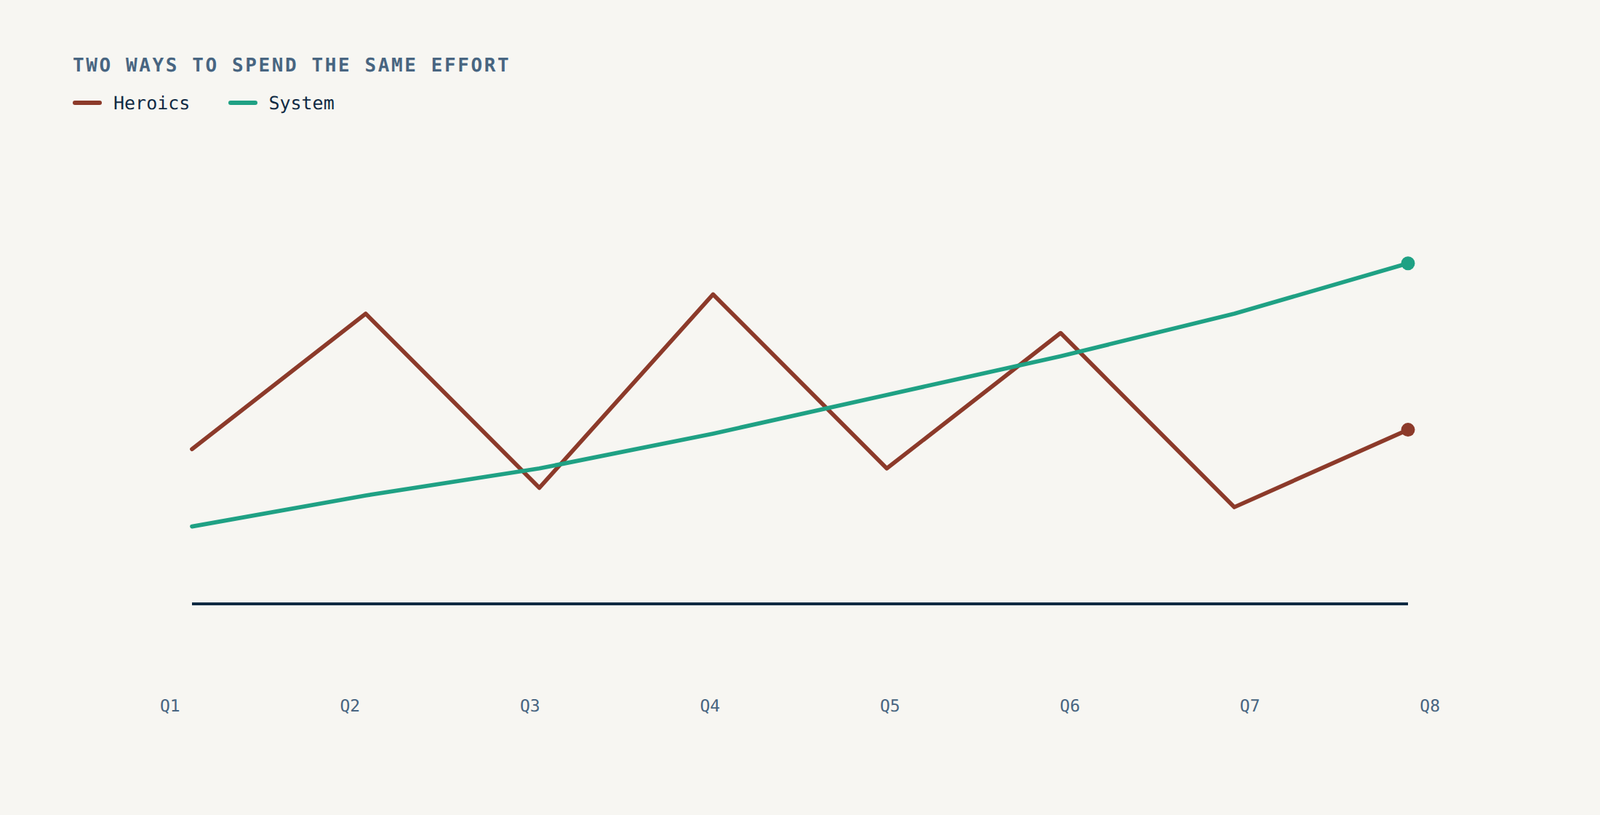
Growth by heroics looks like commitment from the inside. From the outside, it is fragility disguised as a good quarter. It is exhausting in a way compounding growth never is. But it also proves something the scoreboard does not show: the energy is there. Nothing about a heroic save gets easier to repeat under instinct. The company burns the same energy every cycle and calls the flatline 'hard effort yielding results.' Route that same energy through a measured Driver instead of a hero, and it stops resetting every quarter. That is the upside a bottom-quartile score is actually pointing at.
What Changes Once You Measure It
The fix for a bottom-quartile score is not to execute harder. It is to find which of the 25 Drivers is weak and fix that Driver. This is the same way a plant fixes the step in the process, not the crew running it. A 1% improvement compounding across a single Driver adds up. A bottom-quartile company usually has several Drivers with that much room at once. RevGrowth Engine is built to prioritize and stack those improvements, not fix them one at a time. This is how 1% gains on individual Drivers compound into 20 to 40 percent annual growth.
Most companies that run the Benchmark for the first time and land in the bottom two quartiles react with relief, not defensiveness. The score finally explains a plateau that effort alone could not fix. It also explains exactly how much of that plateau is recoverable. It points to something concrete instead of another all-hands push to try harder at what worked last time. The team was never the problem. Nobody had measured the process the team was running through, and nobody had counted how many Drivers were sitting below standard, ready to move.
Frameworks give you opinions. Benchmarks give you position. A position, unlike an opinion about effort, tells you exactly what to fix — and exactly how much upside is sitting behind each fix.
One hour. Your data. Zero cost. Run the RevGrowth Simulation and find out which quartile your own numbers put you in.
Benchmark your strategy. Engineer your growth.
When you’re ready to see where you actually stand, the RevGrowth Simulation is where this starts. One hour, your own numbers, no cost, and no proposal at the end of it.

The RevGrowth Score
Ten minutes to find out where you actually sit.
The findings tell you what the data says. They don't tell you where you are in it. The RevGrowth Score scores your company against some of the same non-negotiables and critical factors we score every benchmarked company on. Ten minutes, online, no call required.
You get a position, not a grade.
Ten minutes. Online. No call required.
The RevGrowth Simulation
Find out which one you are.
The RevGrowth Simulation is a one-hour working session using your own numbers. You'll see where your growth system sits against 200+ mid-market companies, and what the gap is worth.
60 minutes - built on your data - CEO level - no obligation